• Laser & Optoelectronics Progress
  • Vol. 56, Issue 17, 170620 (2019)
Chenxu Lu1, Xiaopeng Dong1、*, Juan Su2, and Xueqin Lei1
Author Affiliations
  • 1 Institute of the Lightwave Technology, School of Electronic Science and Engineering, Xiamen University, Xiamen, Fujian 361005, China
  • 2 Institute of Marine Science and Technology, Shandong University, Qingdao, Shandong 266237, China
  • show less
    DOI: 10.3788/LOP56.170620 Cite this Article Set citation alerts
    Chenxu Lu, Xiaopeng Dong, Juan Su, Xueqin Lei. Characteristics and Sensing Applications of Few-Mode Fiber with Critical Wavelength[J]. Laser & Optoelectronics Progress, 2019, 56(17): 170620 Copy Citation Text show less
    Diagram of the FMF cross-section structure. (a) Geometrical structure and relative refractive index difference profile; (b) scanning electron microscope micrograph
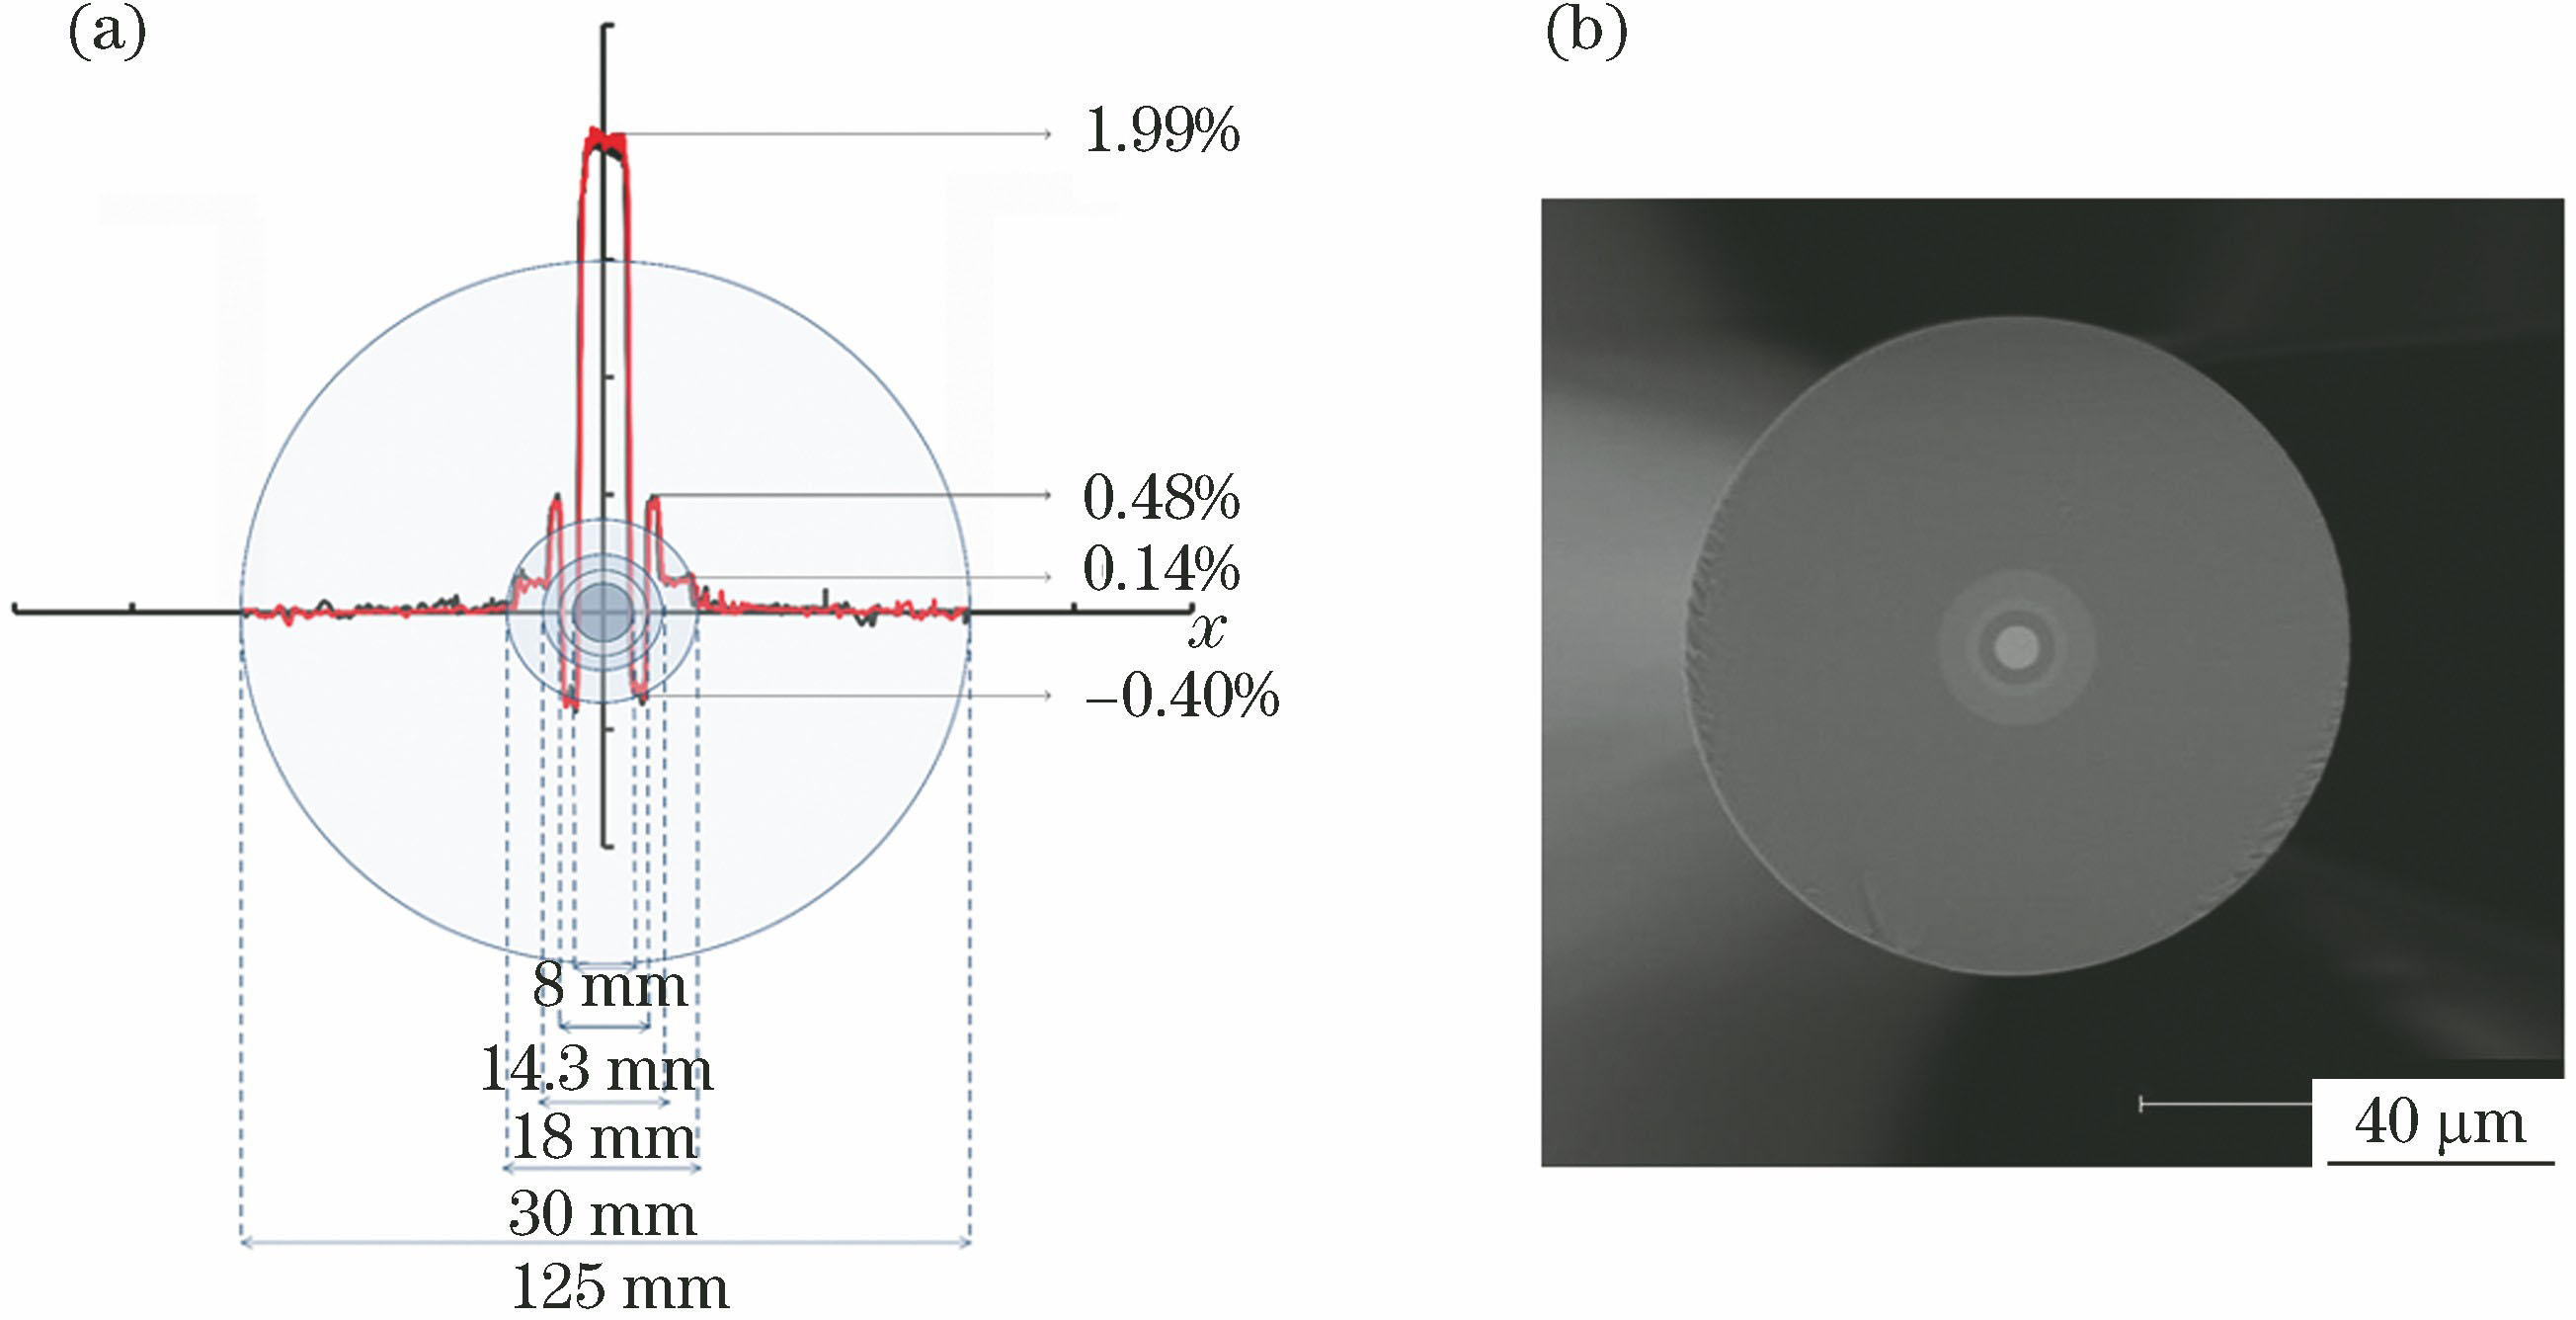
    Fig. 1. Diagram of the FMF cross-section structure. (a) Geometrical structure and relative refractive index difference profile; (b) scanning electron microscope micrograph
    Structure of the SFS
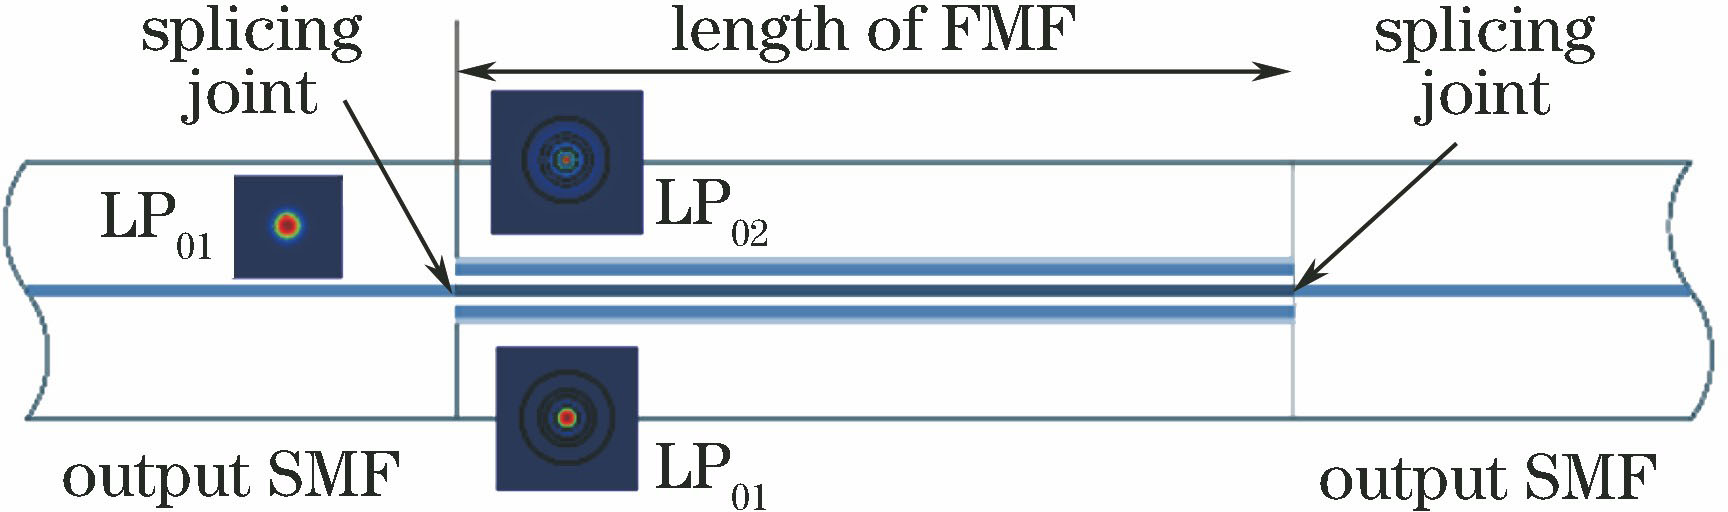
    Fig. 2. Structure of the SFS
    Simulation curves of the propagation constant difference Δβ of LP01 and the LP02 modes propagating in the FMF, and the transmission spectrum of the SFS structure (LFMF=50 cm) under the temperature of 25 ℃ versus wavelength
    Fig. 3. Simulation curves of the propagation constant difference Δβ of LP01 and the LP02 modes propagating in the FMF, and the transmission spectrum of the SFS structure (LFMF=50 cm) under the temperature of 25 ℃ versus wavelength
    Simulation curves of the propagation constant difference Δβ of the LP01 and LP02 modes propagating in the FMF, and the transmission spectra of the SFS structure (LFMF=16 cm) versus wavelength when temperature changes. (a) Δβ without thermal stress; (b) Δβ with thermal stress; (c) transmission spectra without thermal stress;(d) transmission spectra with thermal stress
    Fig. 4. Simulation curves of the propagation constant difference Δβ of the LP01 and LP02 modes propagating in the FMF, and the transmission spectra of the SFS structure (LFMF=16 cm) versus wavelength when temperature changes. (a) Δβ without thermal stress; (b) Δβ with thermal stress; (c) transmission spectra without thermal stress;(d) transmission spectra with thermal stress
    Experimental transmission spectra of the SFS structure (LFMF=16 cm) and critical wavelength shifts when temperature changes. (a) Experimental transmission spectra of the SFS structure; (b) critical wavelength shift versus temperature
    Fig. 5. Experimental transmission spectra of the SFS structure (LFMF=16 cm) and critical wavelength shifts when temperature changes. (a) Experimental transmission spectra of the SFS structure; (b) critical wavelength shift versus temperature
    Transmission spectra of the SFS structure (LFMF=50 cm) versus temperature
    Fig. 6. Transmission spectra of the SFS structure (LFMF=50 cm) versus temperature
    Simulated and experimental results of temperature sensitivity of the interference fringes in the transmission spectrum of the SFS structure
    Fig. 7. Simulated and experimental results of temperature sensitivity of the interference fringes in the transmission spectrum of the SFS structure
    Simulation curves of propagation constant difference Δβ of the LP01 and LP02 modes propagating in the FMF under axial strain variation
    Fig. 8. Simulation curves of propagation constant difference Δβ of the LP01 and LP02 modes propagating in the FMF under axial strain variation
    Results of experimental measurements. (a) Transmission spectra of the SFS structure (LFMF=30 cm) under axial strain variation; (b) critical wavelength shift of CWL versus axial strain
    Fig. 9. Results of experimental measurements. (a) Transmission spectra of the SFS structure (LFMF=30 cm) under axial strain variation; (b) critical wavelength shift of CWL versus axial strain
    Relationship between axial strain sensitivity of the interference fringes in the transmission spectrum of the SFS structure and normalized wavelength
    Fig. 10. Relationship between axial strain sensitivity of the interference fringes in the transmission spectrum of the SFS structure and normalized wavelength
    Output of sensor containing the SFS structure (LFMF=20 cm) varies with temperature and axial strain. (a) Wavelength shifts for PH, 1 and PL, 1 over a 30-min period of the experiment; (b) curves of the applied and calculated axial strains over that time; (c) curves of the applied and calculated temperatures
    Fig. 11. Output of sensor containing the SFS structure (LFMF=20 cm) varies with temperature and axial strain. (a) Wavelength shifts for PH, 1 and PL, 1 over a 30-min period of the experiment; (b) curves of the applied and calculated axial strains over that time; (c) curves of the applied and calculated temperatures
    Sensor outputs of the polyimide-coated SFS structure (LFMF=15 cm) under relative humidity variation. (a) Transmission spectra; (b) wavelength shifts of interference dips DL, 1, DL, 2, DL, 3, and DL, 4
    Fig. 12. Sensor outputs of the polyimide-coated SFS structure (LFMF=15 cm) under relative humidity variation. (a) Transmission spectra; (b) wavelength shifts of interference dips DL, 1, DL, 2, DL, 3, and DL, 4
    Simulation of the propagation constant difference Δβ of LP01 and LP02 modes, and the transmission spectra of the SFS structure (LFMF=35 cm) versus wavelength with different equivalent curvatures of the FMF
    Fig. 13. Simulation of the propagation constant difference Δβ of LP01 and LP02 modes, and the transmission spectra of the SFS structure (LFMF=35 cm) versus wavelength with different equivalent curvatures of the FMF
    Experimental results of the transmission spectra of the SFS structure (LFMF=35 cm) versus wavelength with different curvatures of the FMF
    Fig. 14. Experimental results of the transmission spectra of the SFS structure (LFMF=35 cm) versus wavelength with different curvatures of the FMF
    Simulation and experimental results of the critical wavelength shift versus equivalent curvature of the FMF
    Fig. 15. Simulation and experimental results of the critical wavelength shift versus equivalent curvature of the FMF
    Displacement sensor with large measurement range based on the SFS structure (LFMF=10 cm). (a) Experimental diagram; (b) experimental setup; (c) geometrical mathematical model of circular helix
    Fig. 16. Displacement sensor with large measurement range based on the SFS structure (LFMF=10 cm). (a) Experimental diagram; (b) experimental setup; (c) geometrical mathematical model of circular helix
    Large displacement sensor based on the SFS structure (LFMF=10 cm). (a) Transmission spectra under different displacements; (b) change of the FMF equivalent curvature and shifts of the critical wavelengths under displacement variation
    Fig. 17. Large displacement sensor based on the SFS structure (LFMF=10 cm). (a) Transmission spectra under different displacements; (b) change of the FMF equivalent curvature and shifts of the critical wavelengths under displacement variation
    Simulation of the critical wavelength shifts in the transmission spectra of the etched SFS structure with different dFMF. The inset is the simulation of the propagation constant difference of the LP01 and LP02 modes versus wavelength with different dFMF
    Fig. 18. Simulation of the critical wavelength shifts in the transmission spectra of the etched SFS structure with different dFMF. The inset is the simulation of the propagation constant difference of the LP01 and LP02 modes versus wavelength with different dFMF
    Transmission spectra of the etched SFS structure (LFMF=20 cm, dFMF=21.3 μm) under different SRIs. (a) SRI is 1.316;(b) SRI is 1.383;(c) SRI is 1.423;(d) SRI is 1.439
    Fig. 19. Transmission spectra of the etched SFS structure (LFMF=20 cm, dFMF=21.3 μm) under different SRIs. (a) SRI is 1.316;(b) SRI is 1.383;(c) SRI is 1.423;(d) SRI is 1.439
    Experimental results (marked with error bars) of the critical wavelength shift in the transmission spectrum of the etched SFS structure under surrouding refractive index variation
    Fig. 20. Experimental results (marked with error bars) of the critical wavelength shift in the transmission spectrum of the etched SFS structure under surrouding refractive index variation
    Simulation of the transmission spectra of the etched SFS structure (dFMF=21.3 μm, LFMF=20 cm) and shifts of the critical wavelength and the interference peaks/dips under surrounding refractive index variation. (a) Shifts of the critical wavelength and the interference peaks/dips (DL,1, PL,1, PH,1, DH,1) on each side of the critical wavelength; (b) transmission spectra under the SRIs of 1.350, 1.355, and 1.360
    Fig. 21. Simulation of the transmission spectra of the etched SFS structure (dFMF=21.3 μm, LFMF=20 cm) and shifts of the critical wavelength and the interference peaks/dips under surrounding refractive index variation. (a) Shifts of the critical wavelength and the interference peaks/dips (DL,1, PL,1, PH,1, DH,1) on each side of the critical wavelength; (b) transmission spectra under the SRIs of 1.350, 1.355, and 1.360
    MeasurementparameterMeasurement indexExperimental sensitivitySensing applications
    TemperatureCriticalwavelength0.0401 nm·℃-1Temperature measurementin a large measurementrange (up to a maximum of 800 ℃)
    TemperatureInterferencepeak /dipSensitivity of the interferencepeak is governed by the wavelengthspacing between the peakwavelength and the critical wavelength;the sensitivities of the interferencepeaks increase significantly with thedecreasing of wavelengthspacing; the maximum temperaturesensitivity of the interference peaksfor an SFS structure employinga 30-cm FMF is 0.482 nm·℃-1Temperature measurementwith a high sensitivity, simultaneousmeasurement of temperatureand other environmentalvariables such as strain
    StrainCritical wavelength-0.001 nm·με-1Strain measurement ina large measurement range
    StrainInterferencepeak/dipSimilar as the temperaturesensitivity, the strain sensitivity of theinterference peak is governedby the wavelength spacing betweenthe peak wavelength and the criticalwavelength, and increases significantlywith the decreasing of wavelengthspacing; the maximum strain sensitivityof the interference peaks for anSFS structure employing a 30-cmFMF is -0.027 nm·℃-1Strain measurement withhigh sensitivity; simultaneousmeasurement of strain and temperature
    Relative humidityInterference dip-0.360 nm for perrelative humidity changeRelative humidity measurementwith a high sensitivity
    CurvatureCritical wavelength0.398 nm/m-1Curvaturemeasurement ina large measurement range; largedisplacement measurementwith different measurement ranges
    Surroundingrefractive indexCriticalwavelengthMaximum reflectiveindex sensitivity is2489.796 nm·RIU-1Liquid reflective index measurementwith a large measurementrange up to 1.454 under 532 nm
    Table 1. Summary of the SFS sensing structure with critical wavelength and its applications in different sensing parameters
    Chenxu Lu, Xiaopeng Dong, Juan Su, Xueqin Lei. Characteristics and Sensing Applications of Few-Mode Fiber with Critical Wavelength[J]. Laser & Optoelectronics Progress, 2019, 56(17): 170620
    Download Citation