• Journal of Semiconductors
  • Vol. 42, Issue 12, 124101 (2021)
Thomas Hirtz1, Steyn Huurman2, He Tian1, Yi Yang1, and Tian-Ling Ren1
Author Affiliations
  • 1Institute of Microelectronics, Tsinghua University, Beijing 100084, China
  • 2Department of Computer Science, Tsinghua University, Beijing 100084, China
  • show less
    DOI: 10.1088/1674-4926/42/12/124101 Cite this Article
    Thomas Hirtz, Steyn Huurman, He Tian, Yi Yang, Tian-Ling Ren. Framework for TCAD augmented machine learning on multi- I–V characteristics using convolutional neural network and multiprocessing[J]. Journal of Semiconductors, 2021, 42(12): 124101 Copy Citation Text show less
    (Color online) (a) Diagram representing the workflow of generating the training samples. The simulations are distributed among workers using multiprocessing. Those workers are assigned to the different cores of the CPU and executed concurrently. (b) Structure of a FinFET used for the research. The tunable device parameters, along with their values, are: channel doping concentration (1017 cm–3), gate oxidation thickness (1 nm), and SD doping concentration (8 × 1019 cm–3). (c) Structure of the default NMOS used for the research. The process parameters that can be tuned as well as their default values are: N-well concentration (1017 cm–2), gate oxidation time (10 min), LDD dose (1014 cm–2) and LDD energy (30 keV).
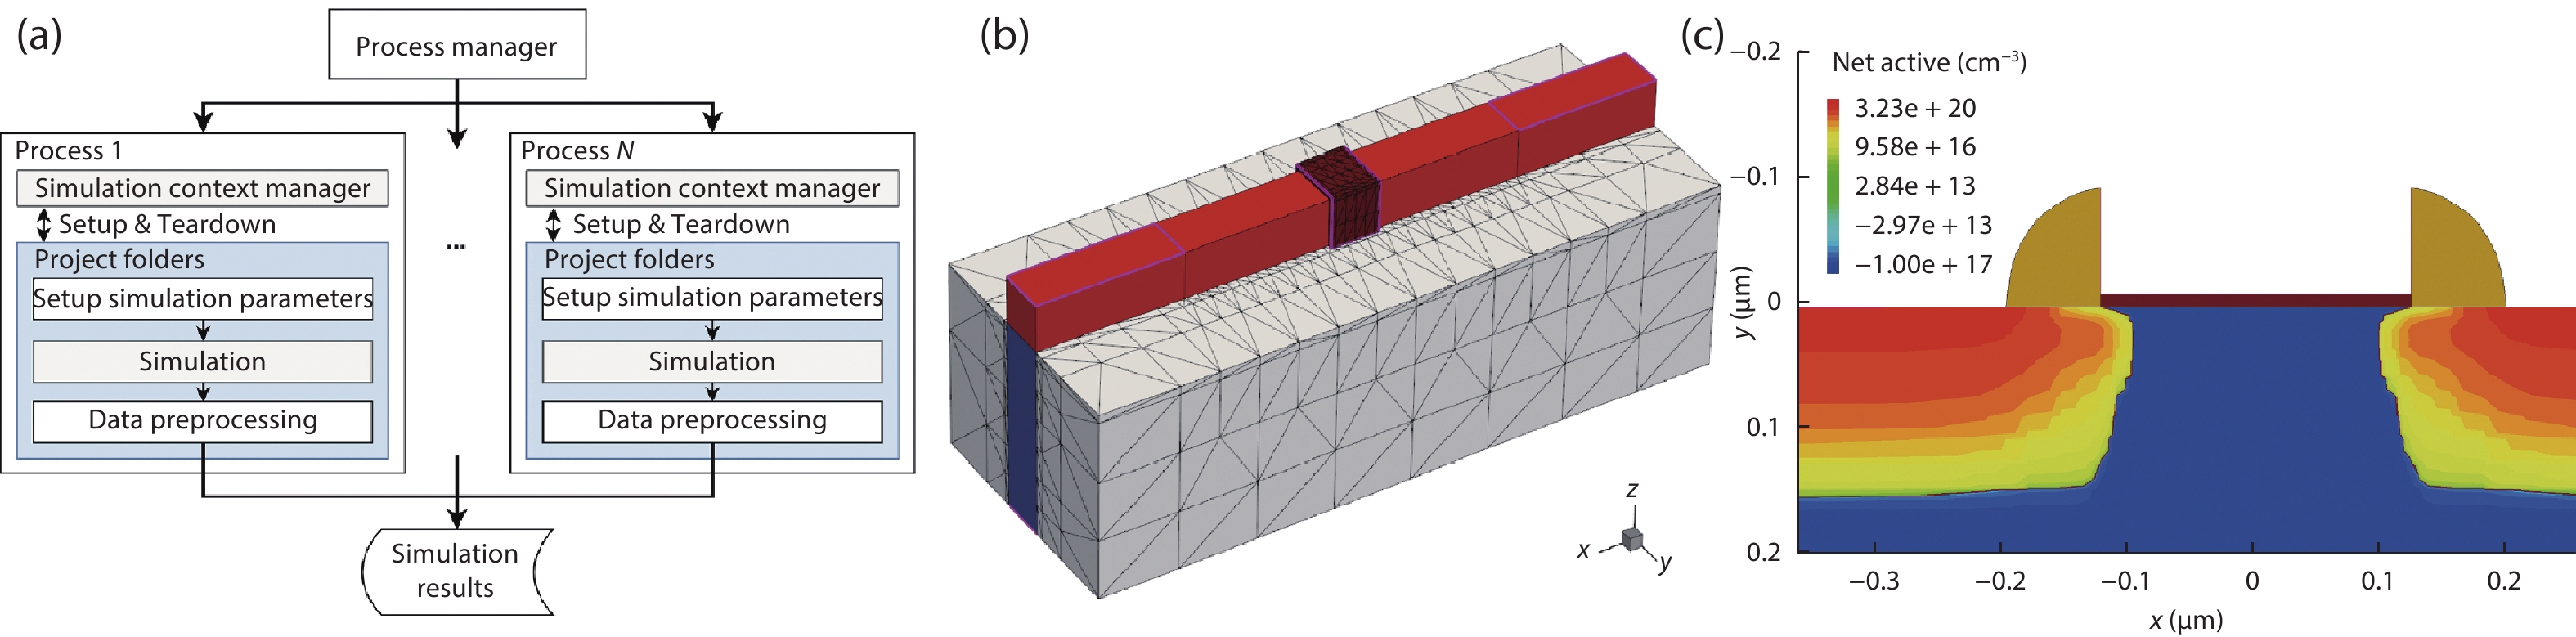
    Fig. 1. (Color online) (a) Diagram representing the workflow of generating the training samples. The simulations are distributed among workers using multiprocessing. Those workers are assigned to the different cores of the CPU and executed concurrently. (b) Structure of a FinFET used for the research. The tunable device parameters, along with their values, are: channel doping concentration (1017 cm–3), gate oxidation thickness (1 nm), and SD doping concentration (8 × 1019 cm–3). (c) Structure of the default NMOS used for the research. The process parameters that can be tuned as well as their default values are: N-well concentration (1017 cm–2), gate oxidation time (10 min), LDD dose (1014 cm–2) and LDD energy (30 keV).
    (Color online) Samples of a training dataset using planar NMOS. Each line represents one curve of a training sample. Five distinct NMOS characteristics are simulated and used: (a) –with fixed at 0.1 and 1 V, (b) –curves with fixed at 1 and 2 V, and (c) the off-state breakdown –. The voltage of the –and –curves does not change from simulation to simulation, they are therefore omitted from the neural network's input. In total, 500 training samples are displayed on the plots.
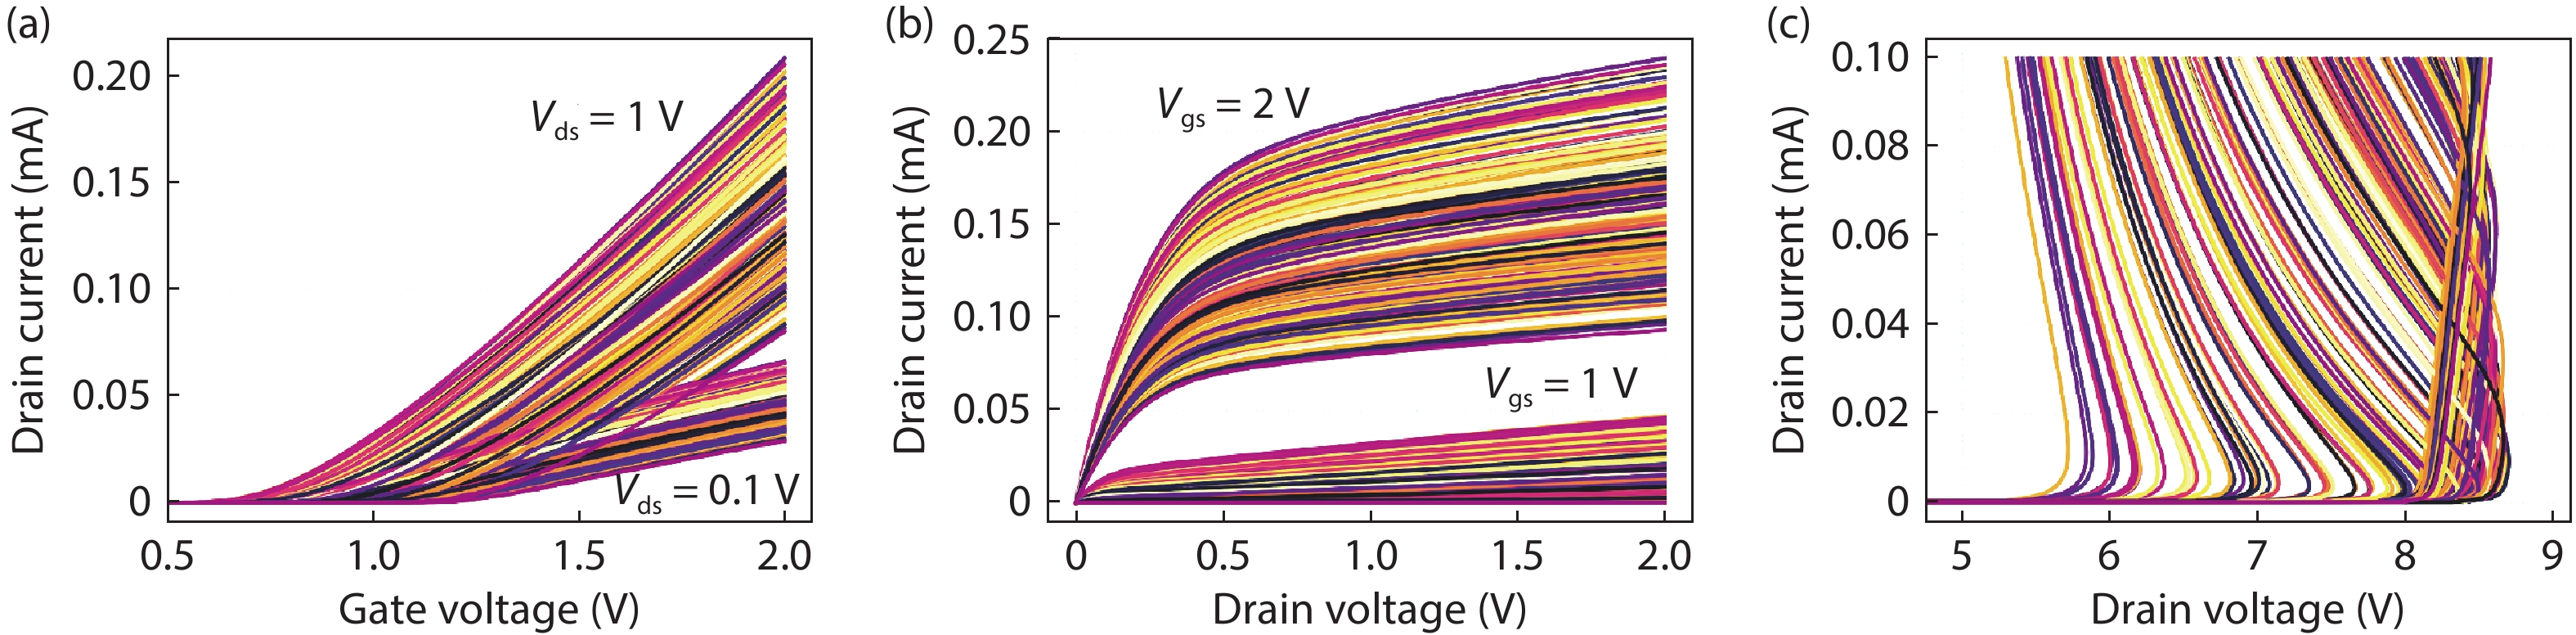
    Fig. 2. (Color online) Samples of a training dataset using planar NMOS. Each line represents one curve of a training sample. Five distinct NMOS characteristics are simulated and used: (a) with fixed at 0.1 and 1 V, (b) curves with fixed at 1 and 2 V, and (c) the off-state breakdown . The voltage of the and curves does not change from simulation to simulation, they are therefore omitted from the neural network's input. In total, 500 training samples are displayed on the plots.
    (Color online) (a) Neural network architecture used for mapping the characteristics of a device to the process parameters. The 13 input channels are composed of the five current characteristics, the voltage of the off-state breakdown curve (when simulating the breakdown curve, the current is set and the voltage is therefore variable, in contrast to the other voltage characteristics), their logarithmic counterpart as well as the index values. (b) Scatter plots representing the values predicted by the network (y-axis) versus the actual values (x-axis). The network can accurately predict the FinFET's device parameters as long as the parameter in question has a strong enough correlation with the simulated curve. A stronger correlation means higher accuracy. In total, 1000 samples are displayed on each plot. The samples were not previously seen by the network. (c) Training curves for the predictions of the parameters for different numbers of training samples. The darker curves represent the exponential moving averages.
    Fig. 3. (Color online) (a) Neural network architecture used for mapping the characteristics of a device to the process parameters. The 13 input channels are composed of the five current characteristics, the voltage of the off-state breakdown curve (when simulating the breakdown curve, the current is set and the voltage is therefore variable, in contrast to the other voltage characteristics), their logarithmic counterpart as well as the index values. (b) Scatter plots representing the values predicted by the network (y-axis) versus the actual values (x-axis). The network can accurately predict the FinFET's device parameters as long as the parameter in question has a strong enough correlation with the simulated curve. A stronger correlation means higher accuracy. In total, 1000 samples are displayed on each plot. The samples were not previously seen by the network. (c) Training curves for the predictions of the parameters for different numbers of training samples. The darker curves represent the exponential moving averages.
    (Color online) (a) Neural network architecture used for mapping the process or device parameters to its electrical characteristics. (b) Training curves for the predictions of characteristics using different numbers of training samples.
    Fig. 4. (Color online) (a) Neural network architecture used for mapping the process or device parameters to its electrical characteristics. (b) Training curves for the predictions of characteristics using different numbers of training samples.
    (Color online) (a) Plots representing NMOS characteristics predicted by the network (solid line) versus the actual values (dotted line) of three samples from the validation dataset. The samples were not previously seen by the network. (b) Prediction of characteristics with three parameters fixed and the N-well concentration spread evenly over its range of value. The gate oxidation time, LDD Dose and LDD Energy are set at 12.5 min, cm–2 and 30 keV, respectively.
    Fig. 5. (Color online) (a) Plots representing NMOS characteristics predicted by the network (solid line) versus the actual values (dotted line) of three samples from the validation dataset. The samples were not previously seen by the network. (b) Prediction of characteristics with three parameters fixed and the N-well concentration spread evenly over its range of value. The gate oxidation time, LDD Dose and LDD Energy are set at 12.5 min, cm–2 and 30 keV, respectively.
    Structure of a classical autoencoder. The input () is feed into an encoder network to get the code (). The input can be then reconstructed () using a decoder network. The goal is to train the encoder and the decoder to have the minimum distance possible between the input and the output while encoding the data.
    Fig. 6. Structure of a classical autoencoder. The input ( ) is feed into an encoder network to get the code ( ). The input can be then reconstructed ( ) using a decoder network. The goal is to train the encoder and the decoder to have the minimum distance possible between the input and the output while encoding the data.
    (Color online) (a) Scatter plots representing the values predicted (y-axis) versus the actual values (x-axis). The black dots are the values predicted by the network using the true characteristics as input. The red dots are the values obtained by first predicting the characteristics from the parameters, and then predicting the parameters from the characteristics. The grey lines represent the ground truth. Coefficients of determination correspond to the scatter plot of their color. A stronger correlation means higher accuracy. In total, 1000 samples are displayed on each plot. The samples were not previously seen by networks. (b) Plots representing NMOS characteristics predicted by the network (solid line) versus the actual values (dotted line) of three samples from the validation dataset. The characteristics were predicted by first predicting parameters using the characteristics, then using those parameters to predict the characteristics.
    Fig. 7. (Color online) (a) Scatter plots representing the values predicted (y-axis) versus the actual values (x-axis). The black dots are the values predicted by the network using the true characteristics as input. The red dots are the values obtained by first predicting the characteristics from the parameters, and then predicting the parameters from the characteristics. The grey lines represent the ground truth. Coefficients of determination correspond to the scatter plot of their color. A stronger correlation means higher accuracy. In total, 1000 samples are displayed on each plot. The samples were not previously seen by networks. (b) Plots representing NMOS characteristics predicted by the network (solid line) versus the actual values (dotted line) of three samples from the validation dataset. The characteristics were predicted by first predicting parameters using the characteristics, then using those parameters to predict the characteristics.
    (Color online) (a) Study of the neural network loss when predicting characteristics. Several numbers of samples and ranges have been tested. The curves are averaged over seven sets of training for 2000 epochs. (b) The statistical parameters used for the study. The process parameter ranges are uniform distributions bounded by: Mean × (1 ± Sigma).
    Fig. 8. (Color online) (a) Study of the neural network loss when predicting characteristics. Several numbers of samples and ranges have been tested. The curves are averaged over seven sets of training for 2000 epochs. (b) The statistical parameters used for the study. The process parameter ranges are uniform distributions bounded by: Mean × (1 ± Sigma).
    (Color online) Neural network loss for predicting characteristics versus the numbers of samples used for training. The different curves represent the number of parameters that are randomized when generating the training set (e.g., for the “1 Parameter” curve, all the parameters except the N-well concentration are fixed). The parameters were added in the following order: N-well concentration, gate oxidation time, LDD dose, and LDD energy. The curves are averaged over seven sets of training for 2000 epochs.
    Fig. 9. (Color online) Neural network loss for predicting characteristics versus the numbers of samples used for training. The different curves represent the number of parameters that are randomized when generating the training set (e.g., for the “1 Parameter” curve, all the parameters except the N-well concentration are fixed). The parameters were added in the following order: N-well concentration, gate oxidation time, LDD dose, and LDD energy. The curves are averaged over seven sets of training for 2000 epochs.
    Thomas Hirtz, Steyn Huurman, He Tian, Yi Yang, Tian-Ling Ren. Framework for TCAD augmented machine learning on multi- I–V characteristics using convolutional neural network and multiprocessing[J]. Journal of Semiconductors, 2021, 42(12): 124101
    Download Citation