
Li Hui, Xia Xianyuan, Chen Tingai, Yu Jia, Li Xi, Zheng Wei. Applications of Two-Photon Excitation Fluorescence Lifetime Imaging in Tumor Diagnosis[J]. Chinese Journal of Lasers, 2018, 45(2): 207010
- Chinese Journal of Lasers
- Vol. 45, Issue 2, 207010 (2018)
![Principle of common fluorescence lifetime detection methods[11,13-14,16,22]. (a) Frequency-domain detection technique; (b) time-correlated single photon counting (TCSPC) technique](/richHtml/zgjg/2018/45/2/0207010/img_1.jpg)
Fig. 1. Principle of common fluorescence lifetime detection methods[11,13-14,16,22]. (a) Frequency-domain detection technique; (b) time-correlated single photon counting (TCSPC) technique
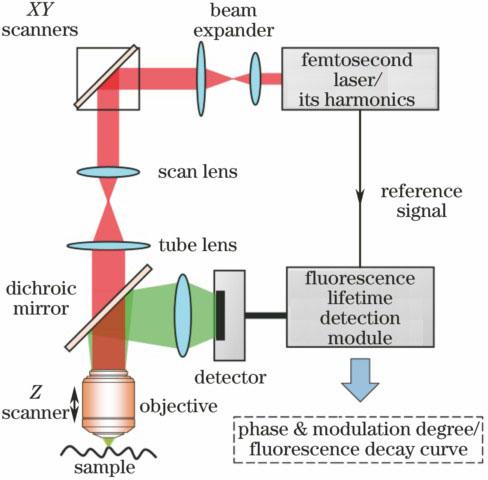
Fig. 2. Schematic of typical two-photon excitation fluorescence lifetime imaging system
Fig. 3. NADH lifetime-coded images of tissues diagnosed as (a) normal, (b) low-grade precancer, and (c) high-grade precancer acquired from the hamster cheek pouch model of oral cancer in vivo[33]; ex vivo imaging of healthy (d) and cancerous (e) human colonic crypts based on NADH; ex vivo imaging of (f) healthy and (g) cancerous human colonic crypts based on FAD[45]
Fig. 4. (a-c) Fluorescence lifetime-coded images and (d-i) fluorescence spectra-coded images of normal and cancerous human gastric mucosa. (a), (d), (g) normal tissue; (b), (e), (h) intestinal-type adenocarcinoma; (c), (f), (i) neuroendocrine carcinoma
Fig. 5. (a-c) Ex vivo imaging of the tumor-to-brain interface of mouse glioma and (d-g) intraoperative imaging of a human glioblastoma. (a) Fluorescence intensity image; (b) two color-coded fluorescence lifetime image; (c) Fluorescence lifetime probability distribution histograms; (d) fluorescence intensity image of arachnoid; (e) fluorescence lifetime-coded image of arachnoid; (f) fluorescence intensity image of solid tumor; (g) fluorescence lifetime-coded image of solid tumor
Fig. 6. Ex vivo imaging of(a-c) normal brain tissue and (d-f) subcutaneous glioma tissue and (g-k) in vivo imaging of orthotopic glioma and glioma-adjacent brain. (a)(d) Fluorescence intensity images; (b)(e) fluorescence lifetime-coded images; (c)(f) fluorescence spectra-coded images; (g) fluorescence intensity image of tumor-adjacent brain tissue; (h) fluorescence intensity image of tumor-to-brain interface; (i) fluorescence intensity image of tumor; (j) NADH fluorescence lifetime; (k) fluorescence spe
Fig. 7. (a-d) Fluorescence lifetime-coded images of freshly excised mouse ear skin for different stages of melanoma development and (e-h) fluorescence lifetime-coded images of excised human sample of basal cell carcinoma with different depth (step size of 30 μm)[55]. (a) Normal tissue; (b) <0.5 mm lesion (about 12 days); (c) 1.5 mm lesion (about 20 days); (d) 2.0-2.5 mm lesion (about 22 days)[54]

Set citation alerts for the article
Please enter your email address
© Copyright 2018-2021 | Chinese Laser Press. All Rights Reserved 沪ICP备15018463号-20