
Zhipeng Wu, Danping Huang, Kang Guo, Jianping Tian, Licheng Wu, Shaodong Yu. Optical Cable Pitch Detection Method Based on Machine Vision[J]. Laser & Optoelectronics Progress, 2020, 57(8): 081505
- Laser & Optoelectronics Progress
- Vol. 57, Issue 8, 081505 (2020)
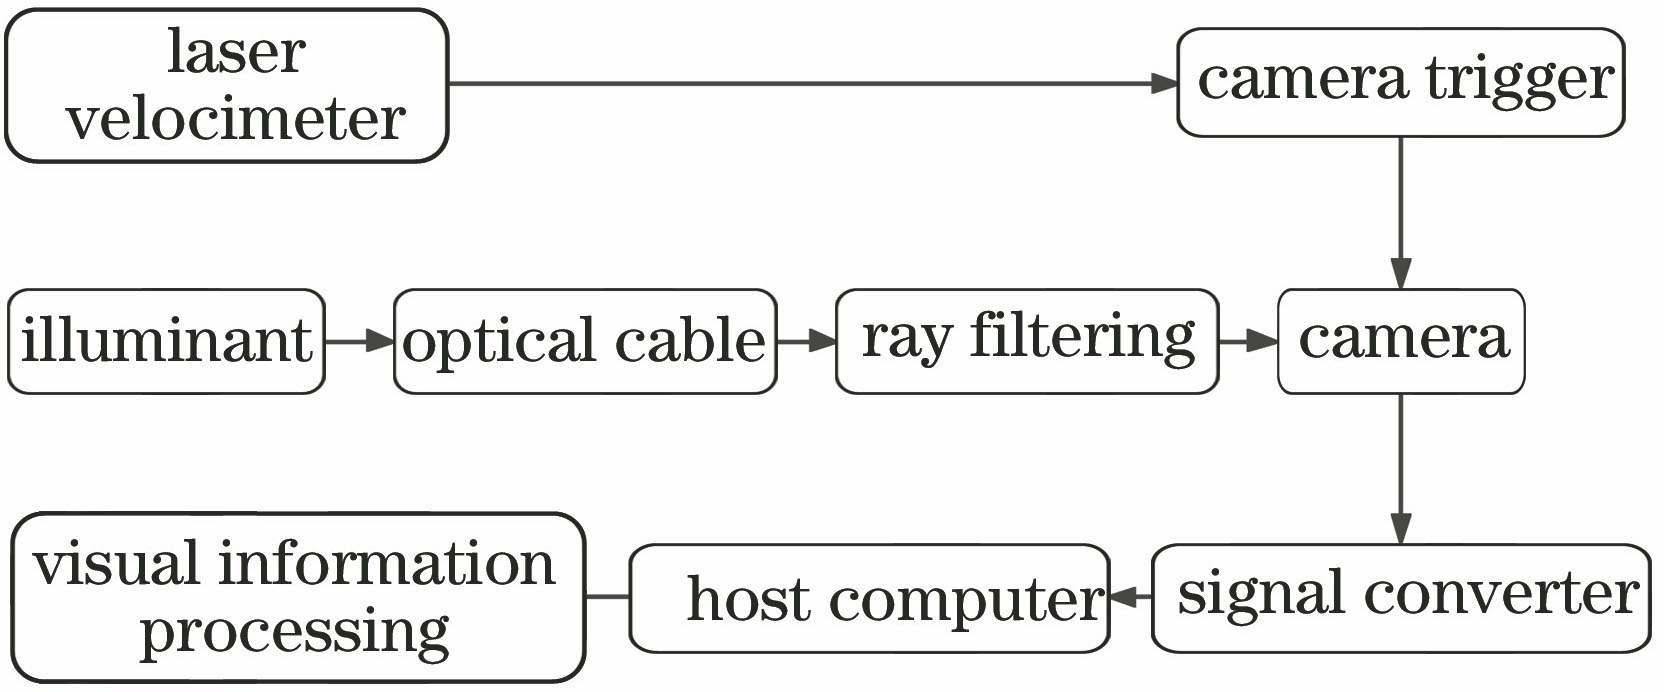
Fig. 1. Diagram of system structure
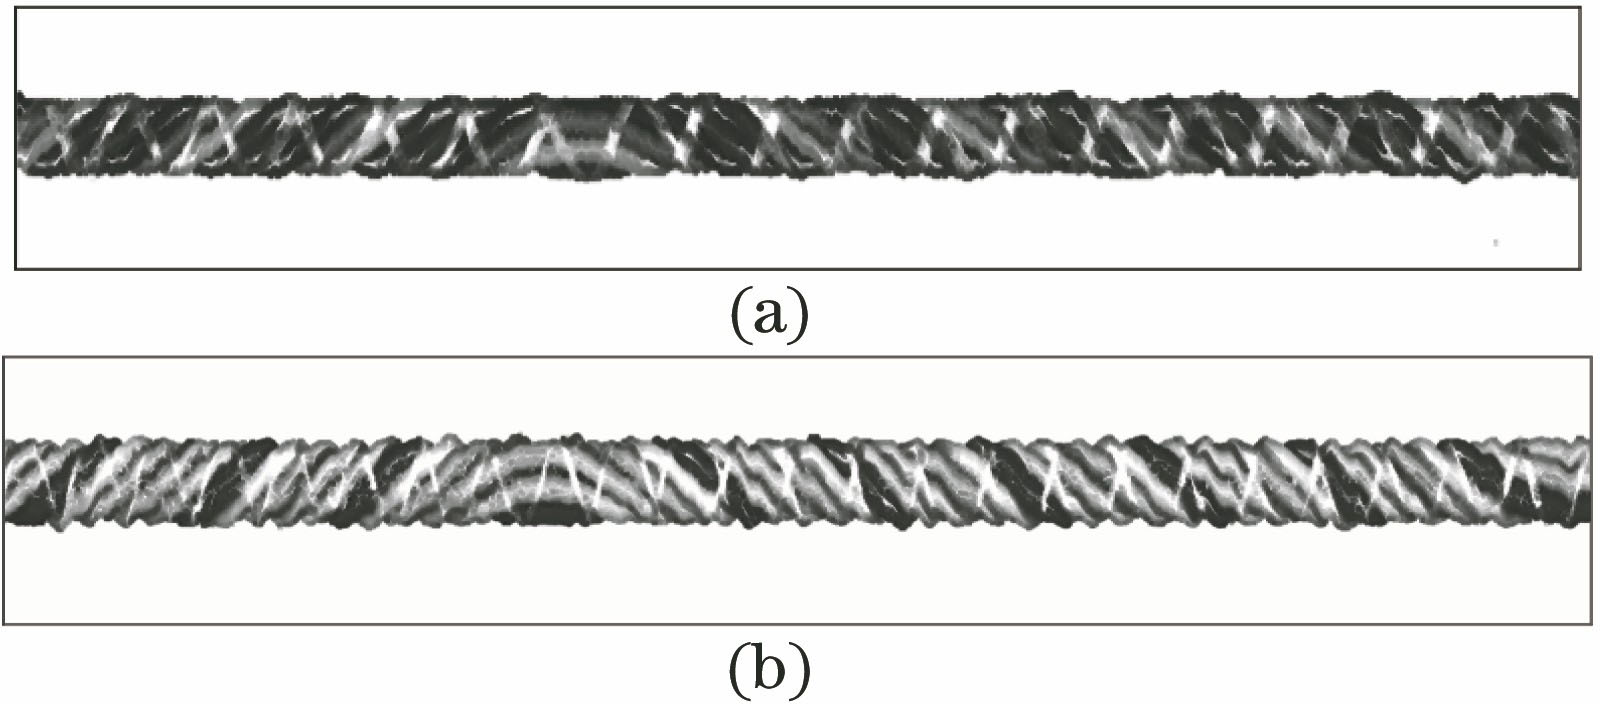
Fig. 2. Optical cable visual information. (a) Class I; (b) class II
Fig. 3. Commutation point and cable pitch
Fig. 4. Influence of different types of visual information. (a) Influence of class I sample cable point and cable ties; (b) influence of class II sample cable ties
Fig. 5. Binarization results of original images. (a) Class I; (b) class II
Fig. 6. Pretreatment process of class Ⅰ cable. (a) Original image; (b) thresholding; (c) denoising; (d) fitting
Fig. 7. Pretreatment process of class Ⅱ cable. (a) Original image; (b) filtering; (c) grayscale stretching; (d) fitting
Fig. 8. Results of matching. (a) Success for matching; (b) failure for matching
Fig. 9. Template area division for different types of commutation points. (a) Model1; (b) model2; (c) model3
Fig. 10. Flow chart of automatically constructing template
Fig. 11. Best template
Fig. 12. Physical image of detection system
Fig. 13. Cable pretreatment results. (a) Class I; (b) class II
Fig. 14. Matching results of template partition precise positioning method
Fig. 15. Numerical results of different matching methods and different types of pitch errors. Direct template matching for (a) class I and (c) class II; template partition precise positioning method for (b) class I and (d) class II
| ||||||||||||||||||||||||||||||||||||||||||||||||
Table 1. Relationship between mean value of the template and matching error rate at different node gray level
|
Table 2. Relationship between v' of optimal filtering structural elements matrix and mean values of node gray level
|
Table 3. Comparison of common template matching and template partition precise positioning method
|
Table 4. Average pitch and error results measured by two types of optical cables

Set citation alerts for the article
Please enter your email address
© Copyright 2018-2021 | Chinese Laser Press. All Rights Reserved 沪ICP备15018463号-20