• Acta Photonica Sinica
  • Vol. 50, Issue 9, 0930001 (2021)
Chi CHEN, Chaoyang ZHANG, Wenjie FU, Dun LU, Tongxing HUANG, and Yang YAN
Author Affiliations
  • School of Electronic Science and Engineering and Terahertz Science, University of Electronic Science and Technology of China, Chengdu610054, China
  • show less
    DOI: 10.3788/gzxb20215009.0930001 Cite this Article
    Chi CHEN, Chaoyang ZHANG, Wenjie FU, Dun LU, Tongxing HUANG, Yang YAN. Electron Temperature Diagnostics in Microwave Plasma Chemical Vapor Deposition by Optical Emission Spectroscopy[J]. Acta Photonica Sinica, 2021, 50(9): 0930001 Copy Citation Text show less
    Schematic diagram of the coaxial microwave driven Plasma with Langmuir probe and emission spectroscopy
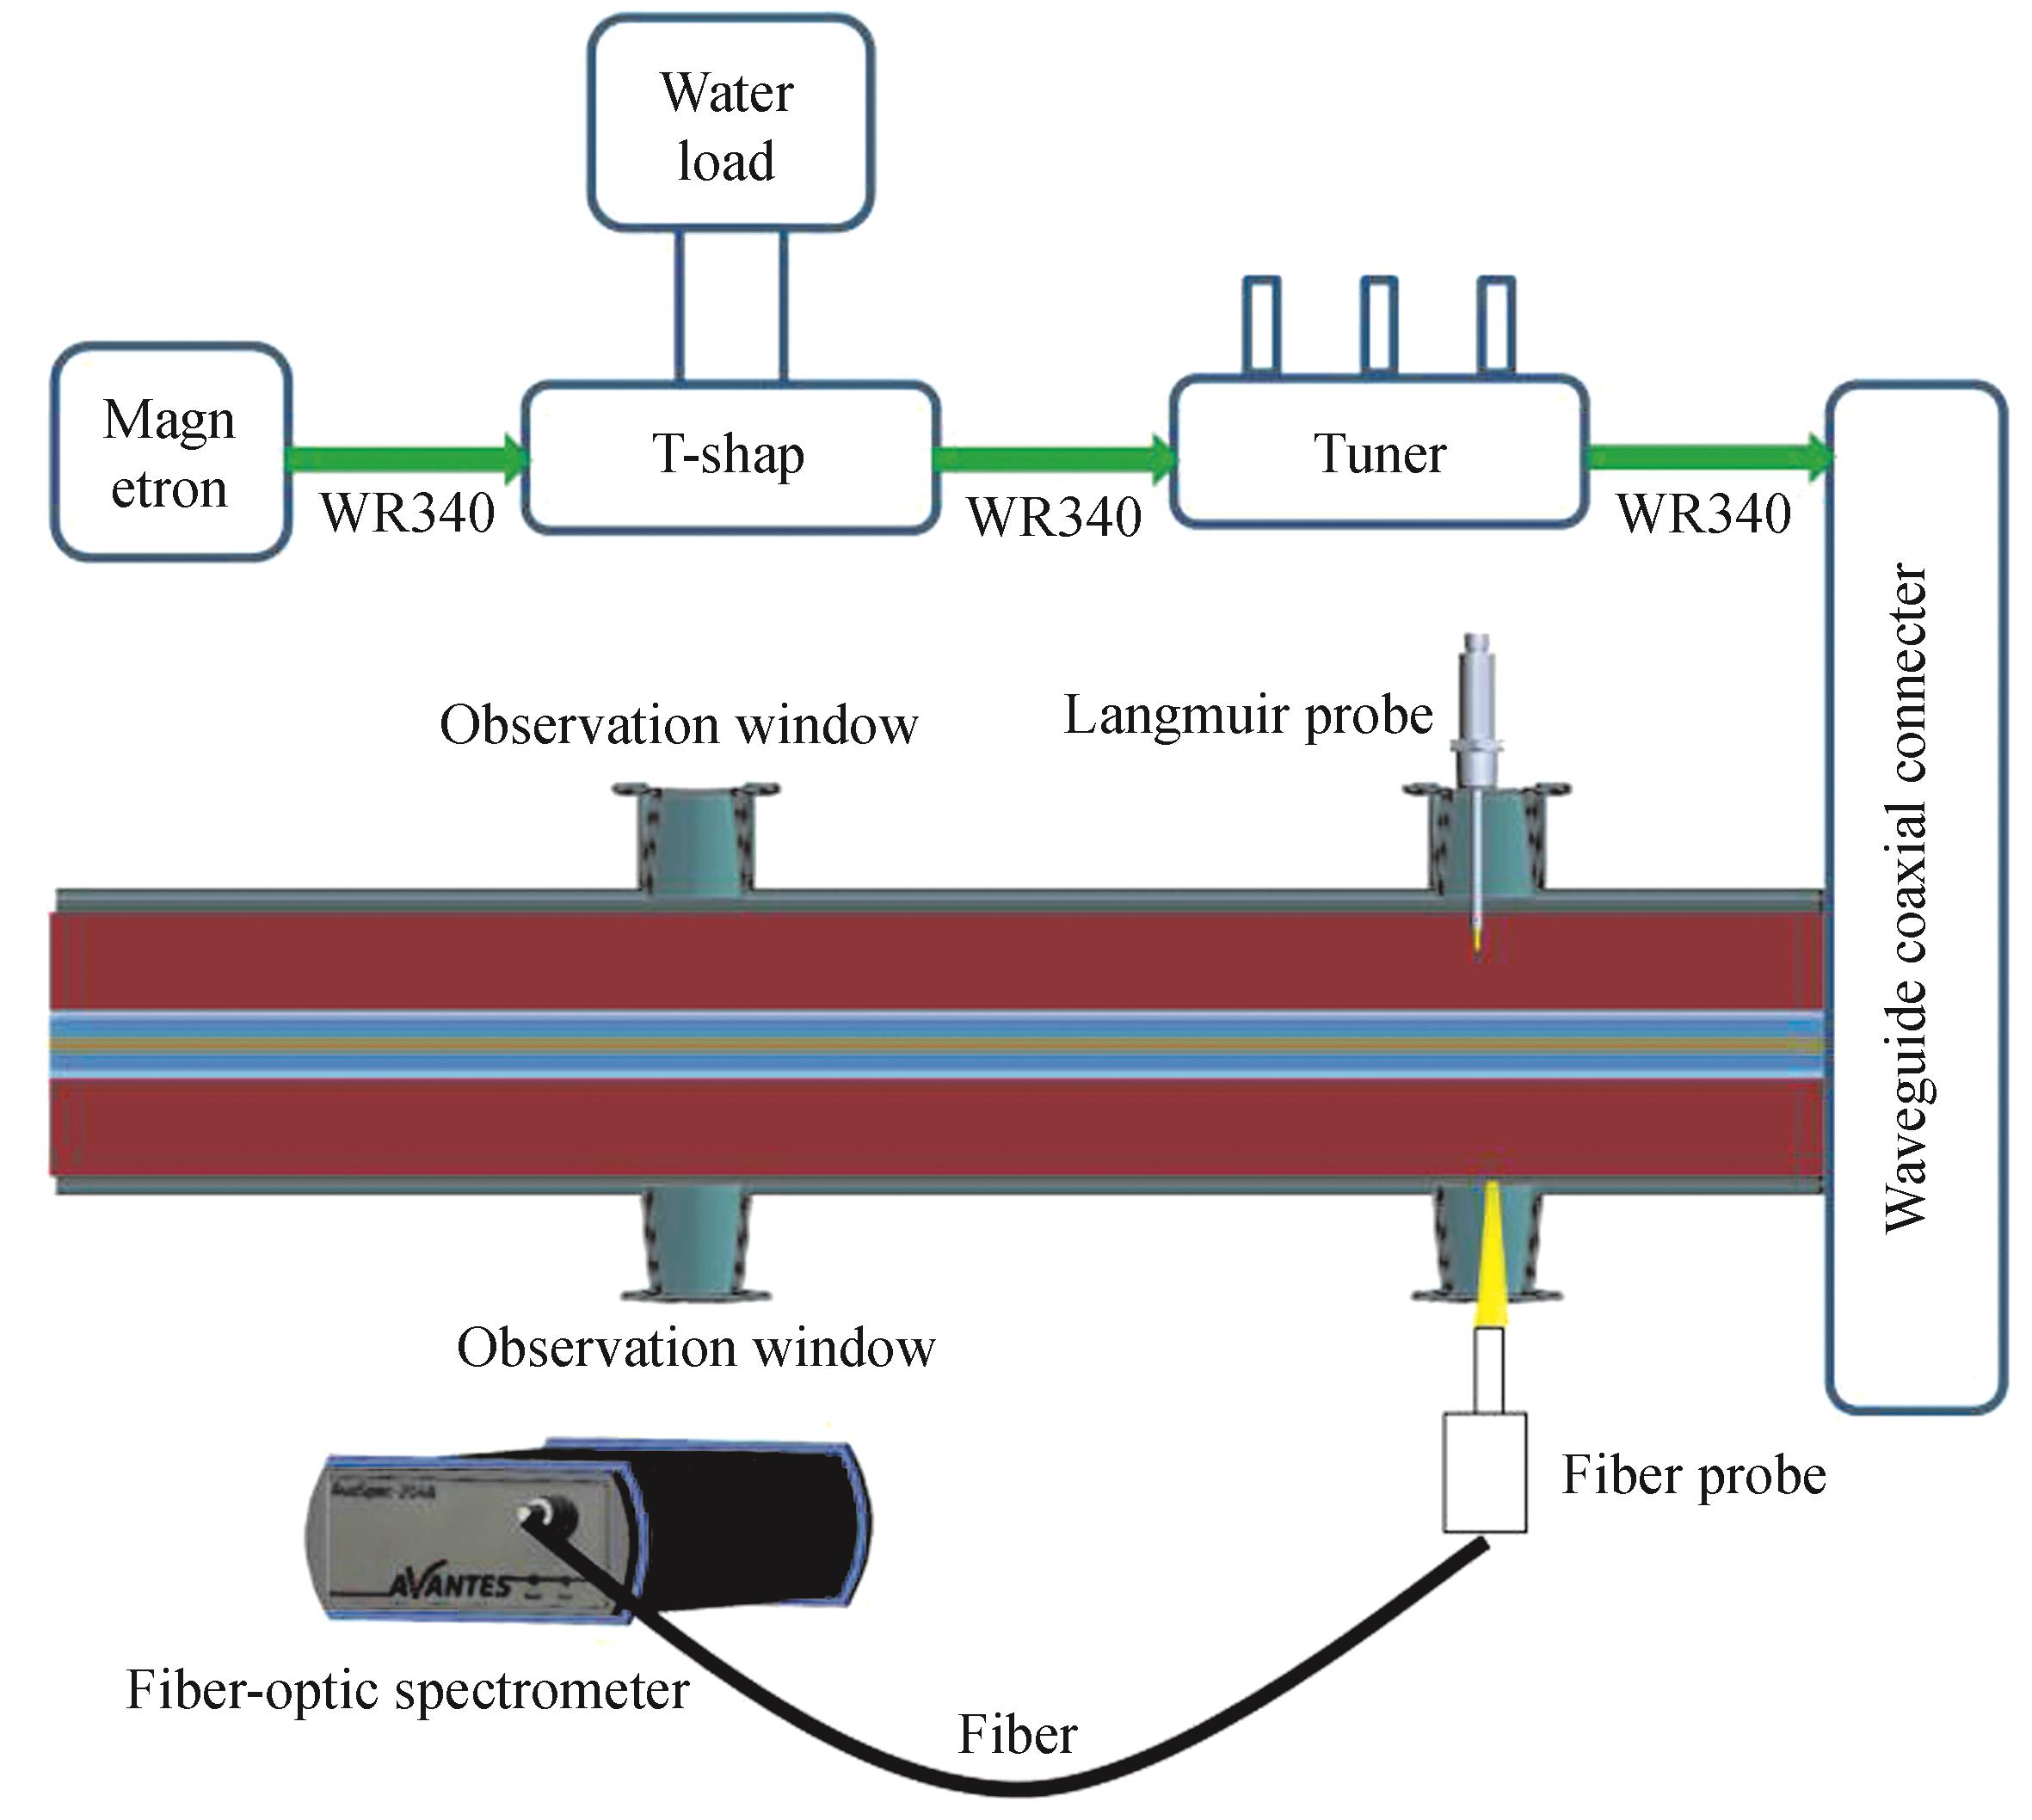
    Fig. 1. Schematic diagram of the coaxial microwave driven Plasma with Langmuir probe and emission spectroscopy
    The structure of the coaxial reaction cavity
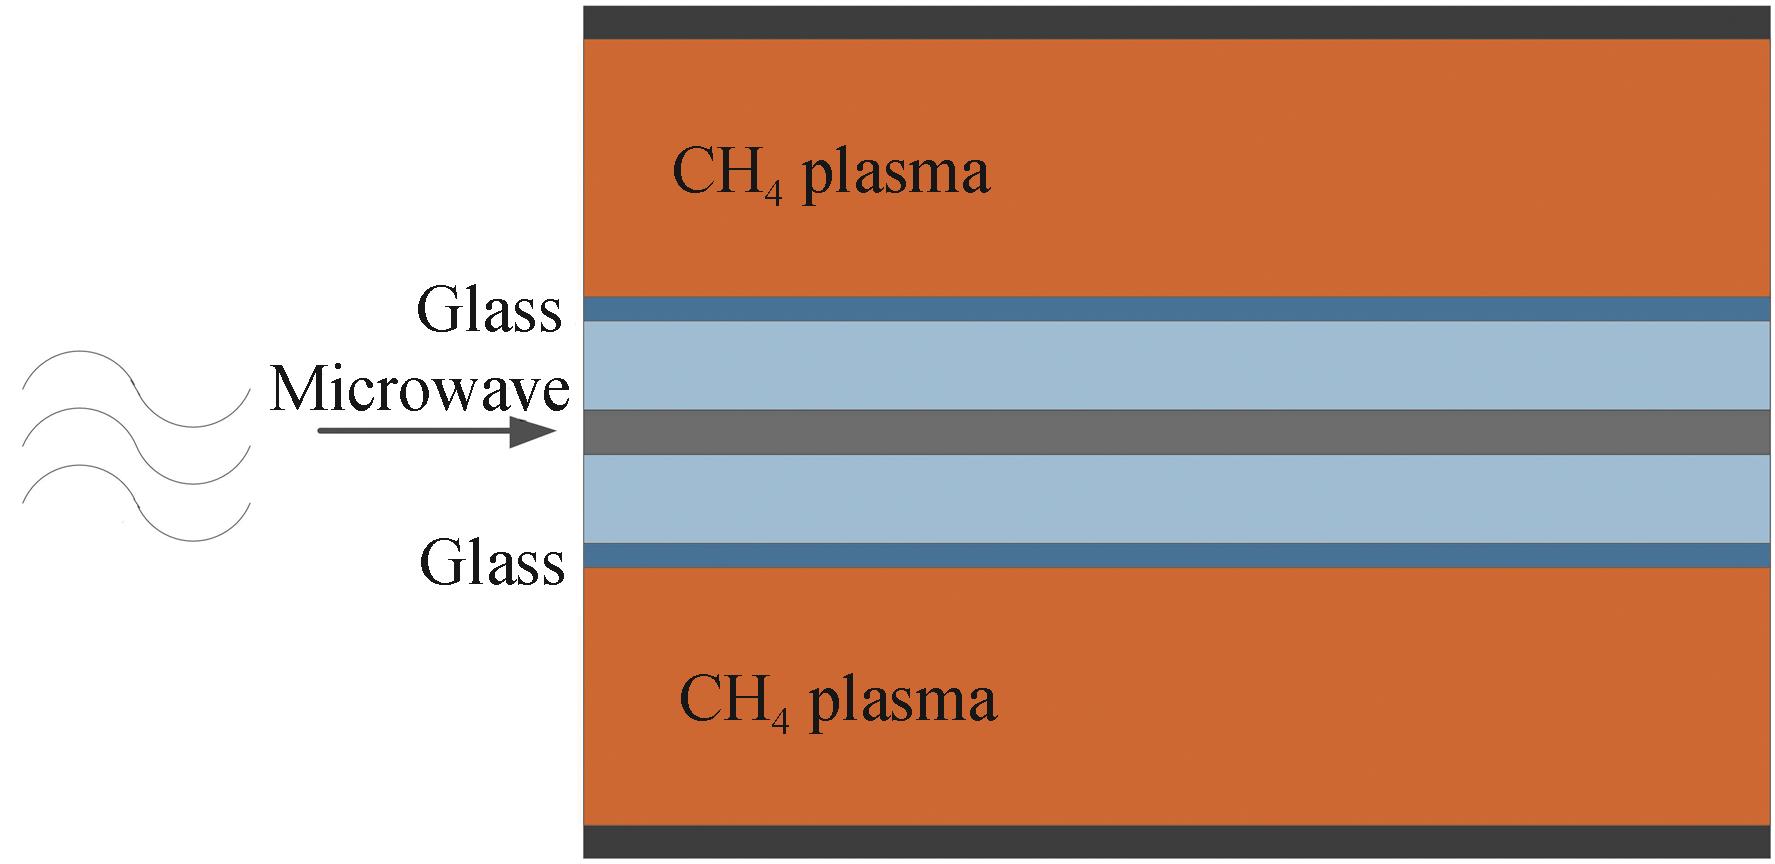
    Fig. 2. The structure of the coaxial reaction cavity
    The spectrum of Ar plasma driven by 800 W microwave at the pressure of 80 Pa
    Fig. 3. The spectrum of Ar plasma driven by 800 W microwave at the pressure of 80 Pa
    Boltzmann plot for Ar lines
    Fig. 4. Boltzmann plot for Ar lines
    The microwave power and pressure against the electron temperature measured by the Langmuir probe and OES
    Fig. 5. The microwave power and pressure against the electron temperature measured by the Langmuir probe and OES
    Coaxial line CH4 plasma driven by 800 W microwave at fill pressure of 80 Pa
    Fig. 6. Coaxial line CH4 plasma driven by 800 W microwave at fill pressure of 80 Pa
    The spectrum of CH4 plasma driven by 800 W microwave at the pressure of 80 Pa
    Fig. 7. The spectrum of CH4 plasma driven by 800 W microwave at the pressure of 80 Pa
    The voltage and current curve of the Langmuir probe in CH4 plasma
    Fig. 8. The voltage and current curve of the Langmuir probe in CH4 plasma
    The microwave power and pressure against the electron temperature by OES
    Fig. 9. The microwave power and pressure against the electron temperature by OES
    Wavelength/nmTransition coefficient/s-1Statistical weightExcitation energy/eV
    706.721 73.80×106513.302 23
    763.510 52.45×107513.171 78
    772.420 71.17×107313.327 86
    801.478 59.30×106513.094 87
    866.794 32.43×106313.153 14
    912.296 71.89×107312.907 02
    922.449 85.00×106513.171 78
    978.450 21.47×106513.094 87
    Table 1. Spectroscopic data of chosen lines in Ar plasma30
    Wavelength/nmTransition coefficient /s-1Statistical weightExcitation energy/eV
    Hγ434.0472.53×1065013.0545
    Ηβ486.1358.41×1063212.7485
    Hα656.2794.41×1071812.0875
    Table 2. Spectroscopic data of chosen lines in CH4 Plasma30
    Chi CHEN, Chaoyang ZHANG, Wenjie FU, Dun LU, Tongxing HUANG, Yang YAN. Electron Temperature Diagnostics in Microwave Plasma Chemical Vapor Deposition by Optical Emission Spectroscopy[J]. Acta Photonica Sinica, 2021, 50(9): 0930001
    Download Citation