• Spectroscopy and Spectral Analysis
  • Vol. 42, Issue 6, 1907 (2022)
Xi TIAN1、1; 2; 3;, Li-ping CHEN2、2; 3;, Qing-yan WANG2、2; 3;, Jiang-bo LI2、2; 3;, Yi YANG2、2; 3;, Shu-xiang FAN2、2; 3;, and Wen-qian HUANG2、2; 3; *;
Author Affiliations
  • 11. College of Information and Electrical Engineering, China Agricultural University, Beijing 100083, China
  • 22. Intelligent Equipment Research Center, Beijing Academy of Agriculture and Forestry Sciences, Beijing 100097, China
  • show less
    DOI: 10.3964/j.issn.1000-0593(2022)06-1907-08 Cite this Article
    Xi TIAN, Li-ping CHEN, Qing-yan WANG, Jiang-bo LI, Yi YANG, Shu-xiang FAN, Wen-qian HUANG. Optimization of Online Determination Model for Sugar in a Whole Apple Using Full Transmittance Spectrum[J]. Spectroscopy and Spectral Analysis, 2022, 42(6): 1907 Copy Citation Text show less
    Schematic of the on-line transmittance spectra measurement system
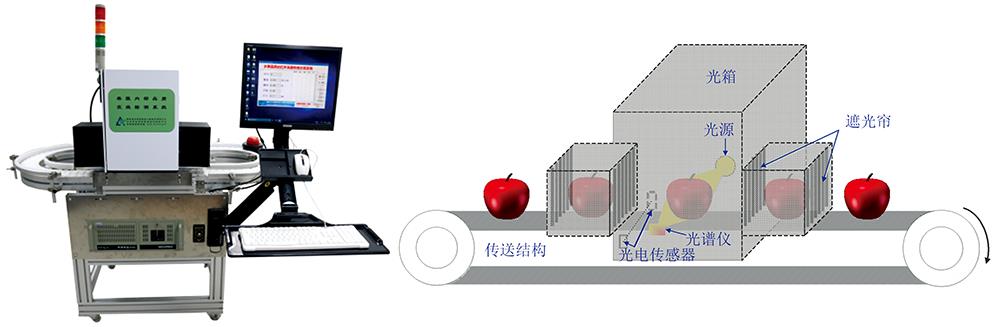
    Fig. 1. Schematic of the on-line transmittance spectra measurement system
    Sugar prediction model based on different detection orientations
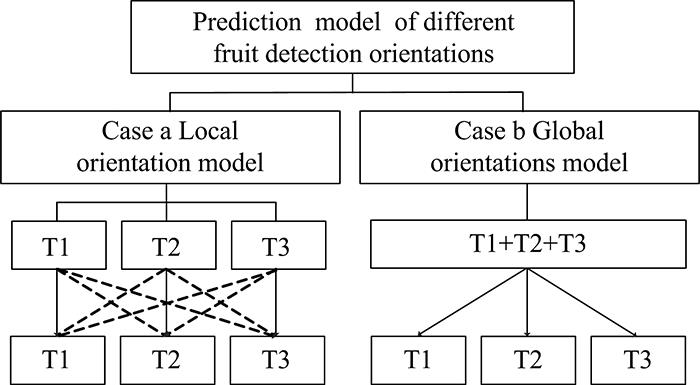
    Fig. 2. Sugar prediction model based on different detection orientations
    The schematic diagram of different detection orientations(a): Different orientations; (b): Spectral collection positions; (c): Raw multi-point transmittance spectra
    Fig. 3. The schematic diagram of different detection orientations
    (a): Different orientations; (b): Spectral collection positions; (c): Raw multi-point transmittance spectra
    Average spectral curves of a whole apple with three different detection orientations
    Fig. 4. Average spectral curves of a whole apple with three different detection orientations
    Spectral intensity changes at 920 nm for different detection orientations
    Fig. 5. Spectral intensity changes at 920 nm for different detection orientations
    Dynamic curves of predictive model performance changing with spectral signal threshold in different detection orientations
    Fig. 6. Dynamic curves of predictive model performance changing with spectral signal threshold in different detection orientations
    Dynamic curves of universal prediction model performance changing with spectral signal threshold in multiple orientations
    Fig. 7. Dynamic curves of universal prediction model performance changing with spectral signal threshold in multiple orientations
    检测姿态预处理方法校正集预测集
    RcRMSEC
    /%
    T1T2T3
    RpRMSEP/%RPDRpRMSEP/%RPDRpRMSEP/%RPD
    T1Raw0.990.850.740.911.150.691.230.890.572.30.69
    Smoothing0.880.760.810.801.450.741.151.110.672.130.75
    SNV0.870.730.790.831.370.711.220.960.532.760.86
    MSC0.880.850.751.280.960.730.931.280.701.251.04
    T2Raw0.990.900.751.190.860.730.931.100.641.301.06
    Smoothing0.860.850.791.071.090.760.891.360.761.001.37
    SNV0.870.850.751.240.980.730.941.260.492.491.11
    MSC0.880.850.751.280.960.730.931.280.701.251.04
    T3Raw0.960.960.601.150.880.611.230.810.671.041.08
    Smoothing0.880.860.661.061.000.691.001.110.770.881.42
    SNV0.800.910.571.390.580.511.250.650.621.241.06
    MSC0.800.910.561.530.740.491.360.860.621.261.06
    Table 1. The detection result of restricted model
    预处理方法校正集预测集
    RcRMSEC
    /%
    T1T2T3
    RpRMSEP/%RPDRpRMSEP/%RPDRpRMSEP/%RPD
    Raw0.940.830.770.861.200.780.851.260.770.861.32
    Smoothing0.830.790.780.851.230.760.871.270.790.841.48
    SNV0.800.870.701.020.940.651.070.890.671.201.34
    MSC0.830.800.740.921.220.690.981.150.701.031.31
    Table 2. The detection result of universal model
    Xi TIAN, Li-ping CHEN, Qing-yan WANG, Jiang-bo LI, Yi YANG, Shu-xiang FAN, Wen-qian HUANG. Optimization of Online Determination Model for Sugar in a Whole Apple Using Full Transmittance Spectrum[J]. Spectroscopy and Spectral Analysis, 2022, 42(6): 1907
    Download Citation