
Wei Song, Jingjing Xing, Yanling Du, Qi He. Underwater Image Enhancement Based on Generative Adversarial Network with Preprocessed Image Penalty[J]. Laser & Optoelectronics Progress, 2021, 58(12): 1210024
- Laser & Optoelectronics Progress
- Vol. 58, Issue 12, 1210024 (2021)
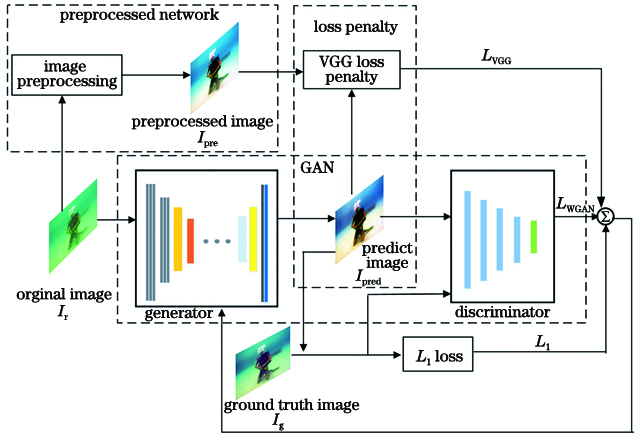
Fig. 1. Framework of our algorithm
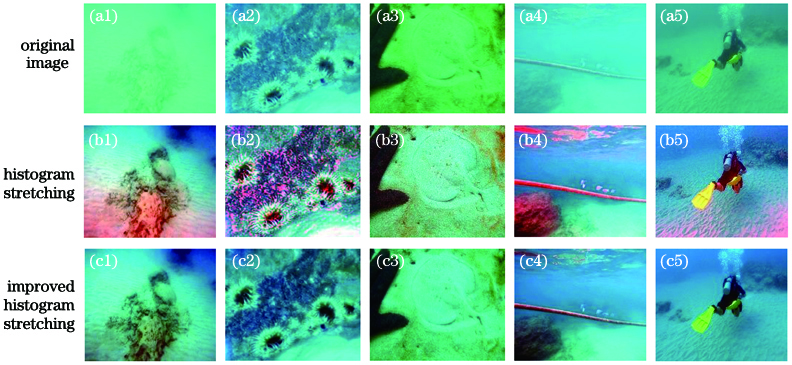
Fig. 2. Images processed by different stretching algorithms. (a) Original image; (b) image processed by traditional histogram stretching algorithm; (c) image processed by improved histogram stretching algorithm improved histogram stretching algorithm
Fig. 3. Structure of the GAN. (a) Generator; (b) convolution block; (c) discriminator
Fig. 4. Enhancement results of different methods on underwater images. (a) Original image; (b) HE; (c) RGHS; (d) UDCP; (e) IBLA; (f) Fusion; (g) Water-Net; (h) Uresnet; (i) FunieGAN; (j) UGAN; (k) ours
Fig. 5. Test results of different methods on the synthetic data set. (a) Orginal image; (b) Water-Net; (c) Uresnet; (d) FunieGAN; (e) UGAN; (f) ours
Fig. 6. Detail retention capabilities of different methods. (a) Original image; (b) details of the solid line frame; (c) details of the dotted line frame; (d) details of the dotted frame
Fig. 7. Detection results of underwater targets. (a) Original image; (b) enhanced image
|
Table 1. PSNR and SSIM of different methods on the UIEBD test set
|
Table 2. UIQM of different methods in EUVP data set
|
Table 3. Influence of penalty items on the image enhancement effect
|
Table 4. Influence of different preprocessing methods on the image enhancement effect

Set citation alerts for the article
Please enter your email address
© Copyright 2018-2021 | Chinese Laser Press. All Rights Reserved 沪ICP备15018463号-20