
Kai Yang, Ruiqi Mao, Qiang An, Zhanshan Sun, Yunqi Fu, "Laser frequency locking method for Rydberg atomic sensing," Chin. Opt. Lett. 21, 021407 (2023)
- Chinese Optics Letters
- Vol. 21, Issue 2, 021407 (2023)
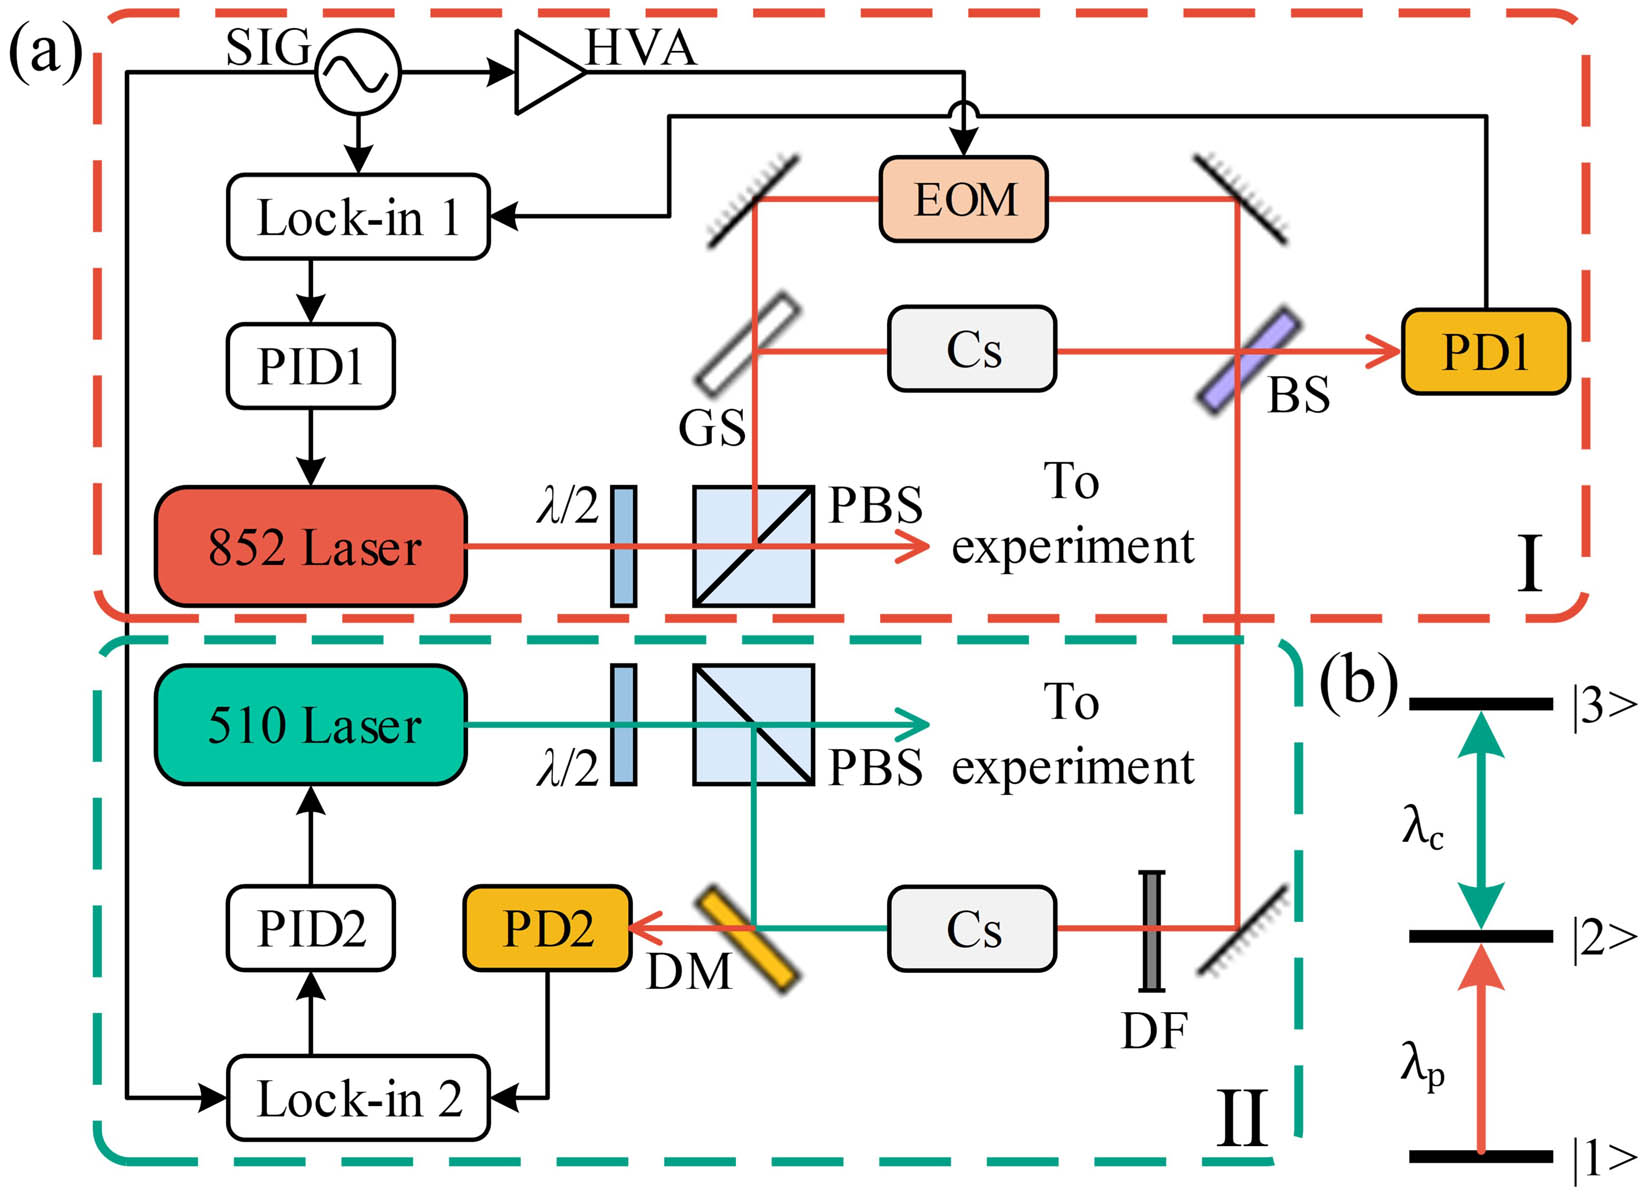
Fig. 1. Illustration of experimental scenarios and energy-level diagram. (a) Diagram of the experimental setup. Zone I is the scheme of the 852 nm probe laser frequency-locking process using the modulated transfer spectral signal. Zone II is the scheme of the 510 nm coupling laser frequency-locking process using the modulated Rydberg EIT signal. These two zones are connected by a typical frequency-modulated probe beam and a 20 kHz sinusoidal signal generated by the same SIG. λ/2, half-wave plate; PBS, polarizing beam splitter; GS, thick glass slide; BS, beam splitter; DF, density filter; DM, dichroic mirror; PD, photodetector; HVA, high-voltage amplifier. (b) Energy-level diagram of the Rydberg EIT ladder scheme consisting of the ground state |1〉 (6S1/2, F = 4), the intermediate state |2〉 (6P3/2, F′ = 5), and the Rydberg state |3〉 (42D5/2).
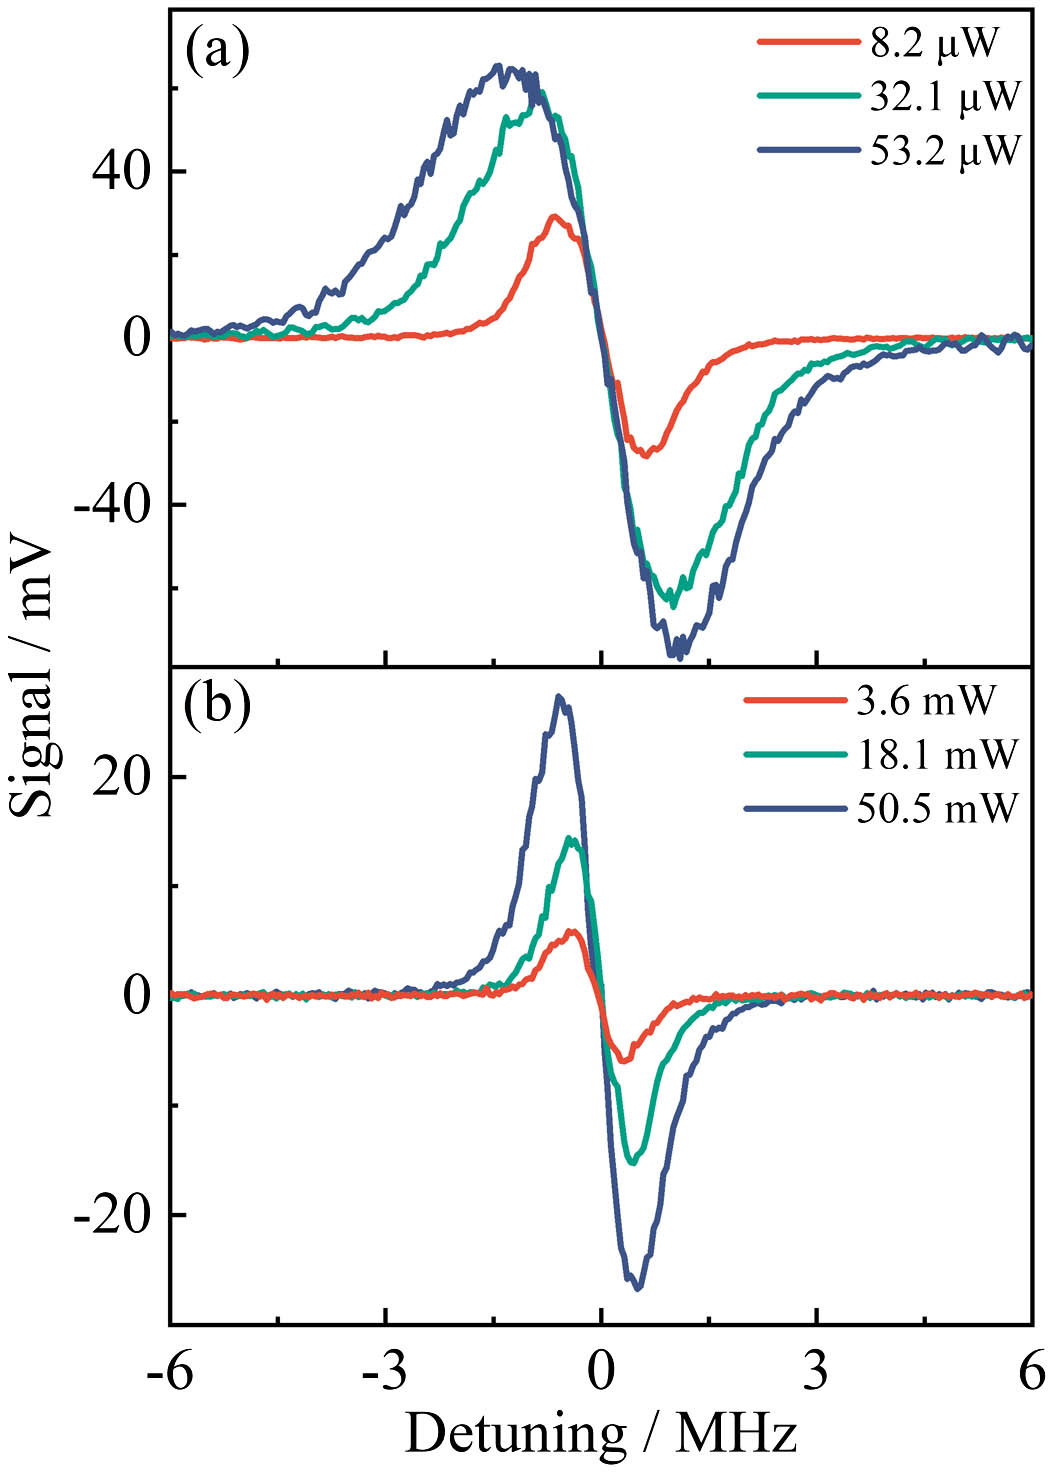
Fig. 2. Error signals under varying probe and coupling beam powers. (a) The coupling beam power is fixed at 91 mW, and the probe beam power is 8.2 µW (red curve), 32.1 µW (green curve), and 53.2 µW (blue curve), respectively. (b) The probe beam power is fixed at 7.6 µW, and the coupling beam power is 3.6 mW (red curve), 18.1 mW (green curve), and 50.5 mW (blue curve), respectively.
Fig. 3. Monitored laser frequency of the coupling laser with and without locking on for a given period of 500 s. After locking on, the coupling laser frequency stability is significantly improved. The inset is the zoom part of the dashed box, indicating that the corresponding frequency stability of the coupling laser reaches ±11.2 MHz for a specific period from 50 s to 100 s.
Fig. 4. The square root of Allan variance as a function of averaging time τ, under the coupling laser free-running (blue squares) and locking-on (red circles) conditions. The dashed line represents a theoretical curve with a slope of −0.5. The minimum measured σ(τ) with a measurement interval of 0.11 s is 7.64 × 10⁻⁹ in free-running condition and 1.58 × 10⁻⁹ in locking-on condition.
Fig. 5. The demodulated baseband signal and its corresponding peak-to-peak variation. (a) Demodulated signal with a modulation period of 0.1 ms; (b) monitored peak-to-peak values of the demodulated signal with a given measurement time of 500 s; the light blue area shows the standard deviation of the data.


Set citation alerts for the article
Please enter your email address

© Copyright 2018-2021 | Chinese Laser Press. All Rights Reserved 沪ICP备15018463号-20