
Fei Sun, Yichao Liu, Yibiao Yang. Optical funnel: broadband and uniform compression of electromagnetic fields to an air neck[J]. Photonics Research, 2021, 9(9): 1675
- Photonics Research
- Vol. 9, Issue 9, 1675 (2021)
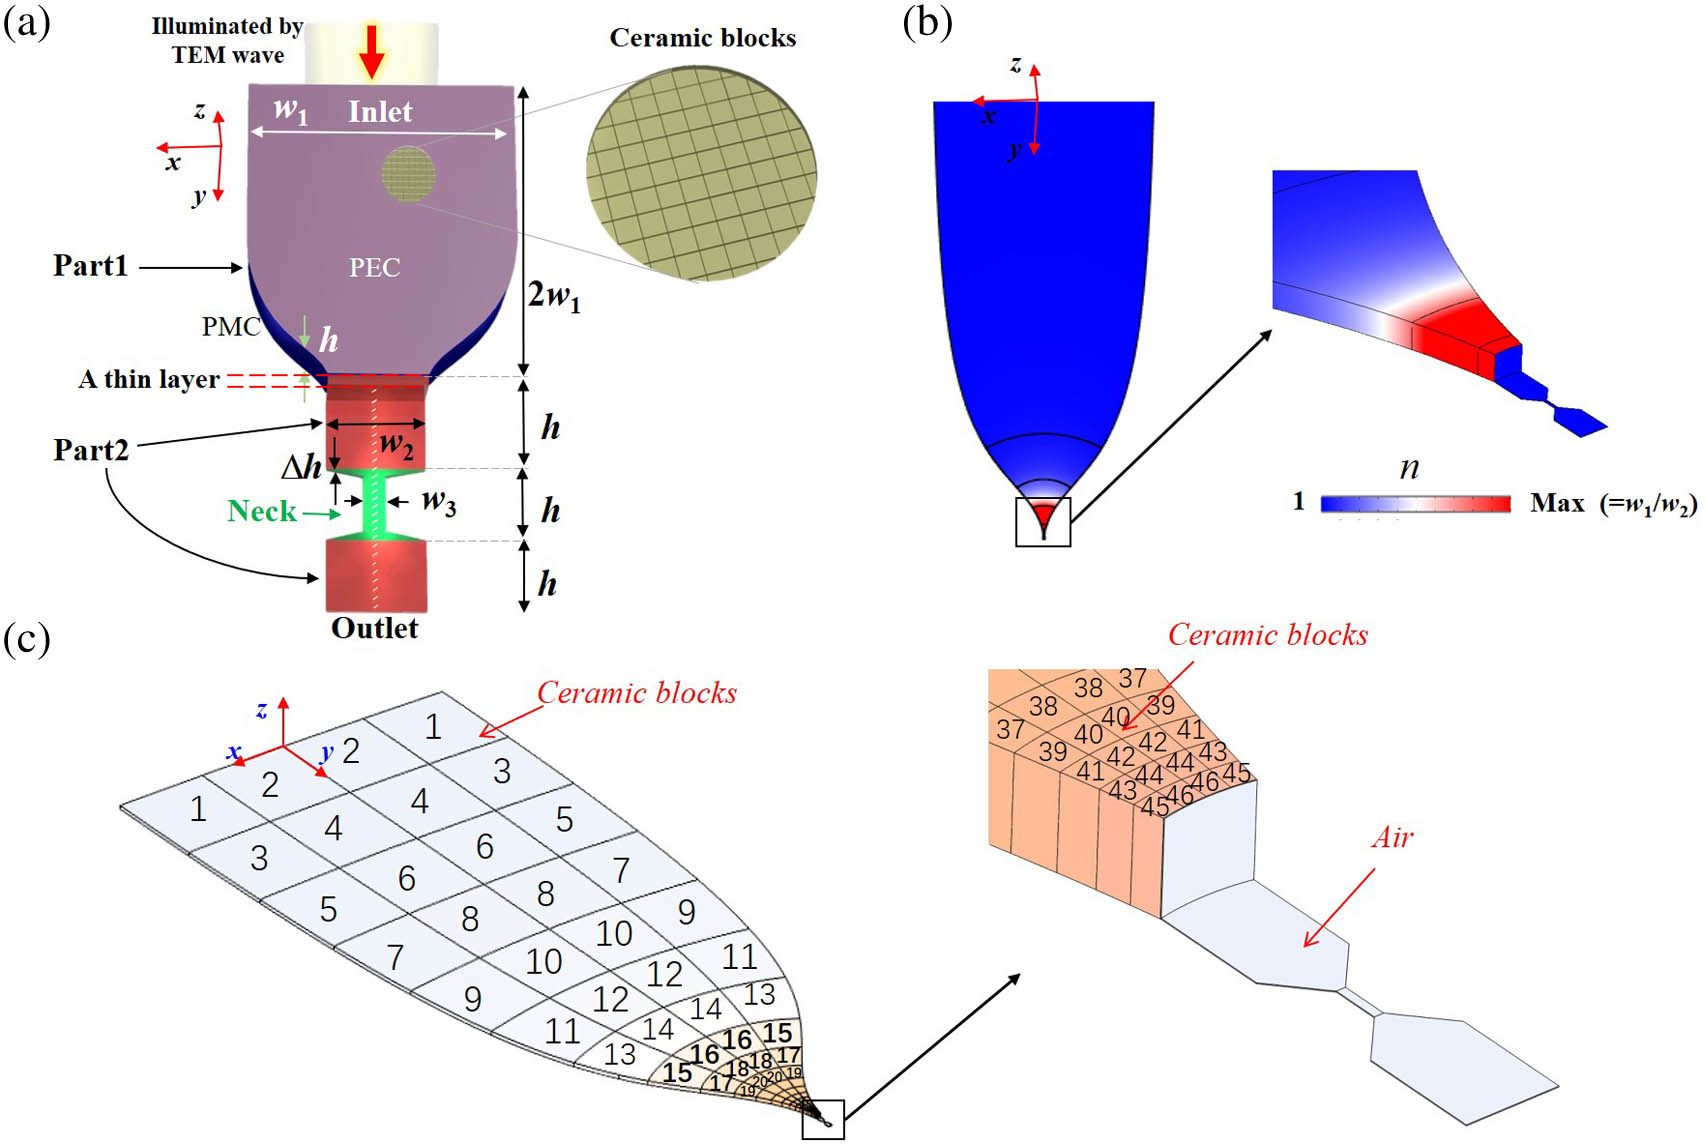
Fig. 1. (a) Structural diagram of the optical funnel. PEC (colored pink) and PMC (colored blue) are used as the top/bottom and side boundaries of the whole funnel, respectively. To show the internal structure of the funnel more clearly, the PEC and PMC on part 2 (colored red) and the neck (colored green) are not drawn. (b) Refractive index distribution of the whole structure. (c) An implementable structure of the designed optical funnel by filling ceramic blocks with different permittivity (indicated by different colors and numbers) or air inside the waveguide, where w 1 = 2 λ 0 / 3 w 2 = 0.01 w 1 w 3 = 0.001 w 1 h = 0.01 w 1 Δ h = 0.01 h λ 0 = 3 m
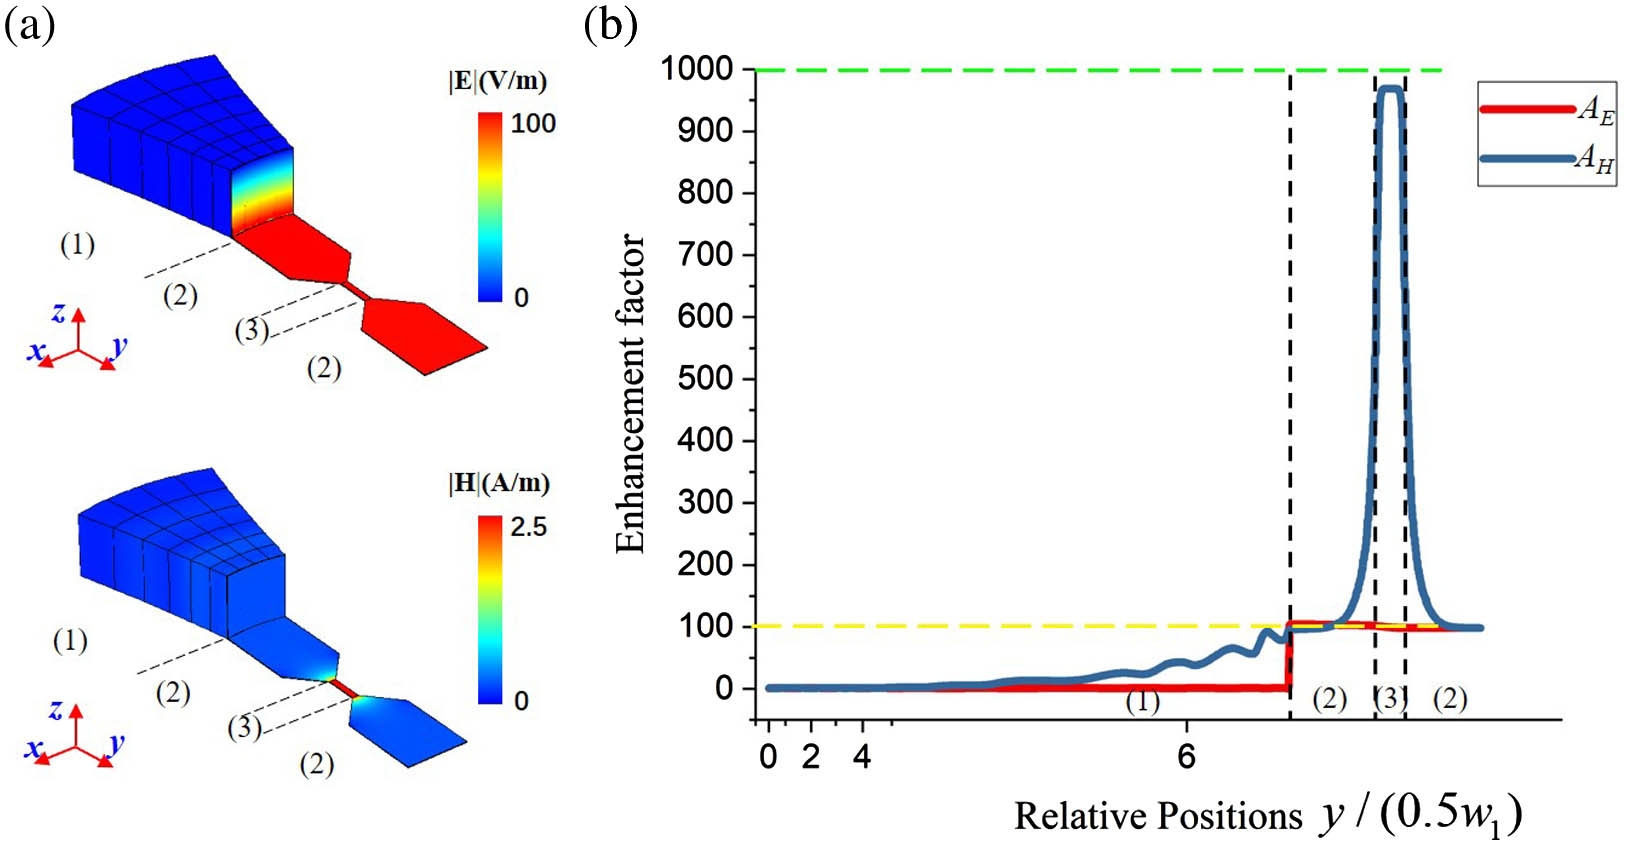
Fig. 2. Simulated results. (a) Amplitudes of electric fields and magnetic fields distributions inside the funnel when a TEM wave of unit amplitude is illuminated onto the inlet of the designed optical funnel. (b) Electric fields (red) and magnetic fields (blue) enhancement factor along the axis of the optical funnel (x = 0 w 1 = 2 / 3 λ 0 w 2 = 0.01 w 1 w 3 = 0.1 w 2 h = 0.01 w 1 Δ h = 0.01 h
Fig. 3. Average value (dots; left y y y y y y w 1 / w 2 = 100 w 1 / w 3 = 1000
Fig. 4. (a), (b) Numerical simulation and (c), (d) theoretical calculation results for the electric and magnetic fields enhancement factors in the funnel’s air neck, respectively, when the funnel-width ratios (w 1 / w 2 w 2 / w 3
Fig. 5. Simulated results: the relation between the working frequency and the electric/magnetic fields enhancement factors A E A H w 1 / w 2 = 100 w 1 / w 3 = 1000
Fig. 6. (a) In the reference space, 2D structural correspondence between the rectangular waveguides and (b) the optical funnel in the real space, respectively, based on the coordinate transformation in Eq. (4 ).
Fig. 7. Funnel 2D view (x − y 1 (a). Different y y = y 1 y = y 2 y = y 3 y = y 4
|
Table 1. Permittivity of the Ceramic Blocksa

Set citation alerts for the article
Please enter your email address
© Copyright 2018-2021 | Chinese Laser Press. All Rights Reserved 沪ICP备15018463号-20