• Laser & Optoelectronics Progress
  • Vol. 58, Issue 16, 1630006 (2021)
Ruochen Dai1, Mingfu Zhao1, Bin Tang1、*, Liyong Dai1, Taojiang Wu1、2, and Shanghai Jiang1
Author Affiliations
  • 1Intelligent Fiber Sensing Technology of Chongqing Municipal Engineering Research Center of Institution of Higher Education, Chongqing Key Laboratory of Fiber Optic Sensor and Photodetector, Chongqing University of Technology, Chongqing 400054, China
  • 2Tielian Operation and Maintenance of Chongqing Municipal Engineering Research Center of Institution of Higher Education, Chongqing 402260, China
  • show less
    DOI: 10.3788/LOP202158.1630006 Cite this Article Set citation alerts
    Ruochen Dai, Mingfu Zhao, Bin Tang, Liyong Dai, Taojiang Wu, Shanghai Jiang. Wire Rope Defect-Detection Method Based on Otsu Segmentation and Edge Detection[J]. Laser & Optoelectronics Progress, 2021, 58(16): 1630006 Copy Citation Text show less
    Wire rope detection system
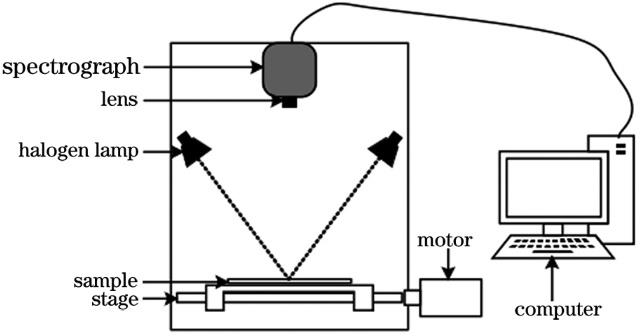
    Fig. 1. Wire rope detection system
    Damaged wire rope sample
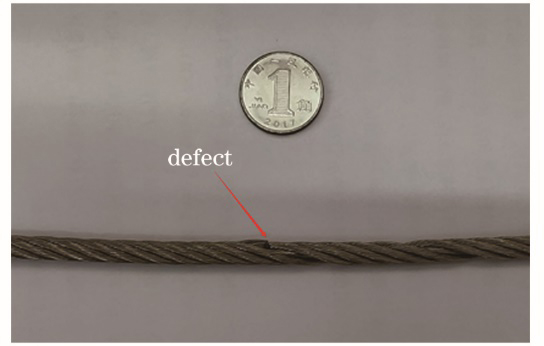
    Fig. 2. Damaged wire rope sample
    Hyperspectral images of wire rope with defects. (a) 410 nm band image; (b) 470 nm band image; (c) 566 nm band image; (d) 661 nm band image; (e) 737 nm band image; (f) 793 nm band image
    Fig. 3. Hyperspectral images of wire rope with defects. (a) 410 nm band image; (b) 470 nm band image; (c) 566 nm band image; (d) 661 nm band image; (e) 737 nm band image; (f) 793 nm band image
    Spectral curves of the wire rope area with the defect and the background area. (a) Reflectivity of randomly selected ROIs; (b) two parts of ROI reflectivity after average processing
    Fig. 4. Spectral curves of the wire rope area with the defect and the background area. (a) Reflectivity of randomly selected ROIs; (b) two parts of ROI reflectivity after average processing
    Hyperspectral images and gray histograms. (a) 406 nm band image and its grayscale histogram; (b) 566 nm band image and its grayscale histogram; (c) 645 nm band image and its grayscale histogram
    Fig. 5. Hyperspectral images and gray histograms. (a) 406 nm band image and its grayscale histogram; (b) 566 nm band image and its grayscale histogram; (c) 645 nm band image and its grayscale histogram
    Image threshold segmentation results at different wavelengths. (a) 406 nm band image; (b) 566 nm band image; (c) 645 nm band image
    Fig. 6. Image threshold segmentation results at different wavelengths. (a) 406 nm band image; (b) 566 nm band image; (c) 645 nm band image
    Comparison of edge detection results based on different operators. (a) Roberts operator; (b) Sobel operator; (c) Prewitt operator; (d) Canny operator
    Fig. 7. Comparison of edge detection results based on different operators. (a) Roberts operator; (b) Sobel operator; (c) Prewitt operator; (d) Canny operator
    Hyperspectral images after Hough transform. (a) Based on Roberts operator; (b) based on Sobel operator; (c) based on Prewitt operator; (d) based on Canny operator
    Fig. 8. Hyperspectral images after Hough transform. (a) Based on Roberts operator; (b) based on Sobel operator; (c) based on Prewitt operator; (d) based on Canny operator
    Position1234567
    Number of pixels Ni94.1391.0193.0292.1463.0191.0092.02
    Absolute deviation value2.111.011.000.1229.011.020
    Distance value2.091.000.990.1228.721.000
    Table 1. Number of pixels at different positions of the wire rope
    Treatment methodMSEPSNRSSIM
    Otsu segmentation1888.415.36990.9572
    Hough transform5316.810.87430.0024
    Otsu+Hough650.919.99570.9404
    Table 2. Treatment effect of different methods
    Ruochen Dai, Mingfu Zhao, Bin Tang, Liyong Dai, Taojiang Wu, Shanghai Jiang. Wire Rope Defect-Detection Method Based on Otsu Segmentation and Edge Detection[J]. Laser & Optoelectronics Progress, 2021, 58(16): 1630006
    Download Citation