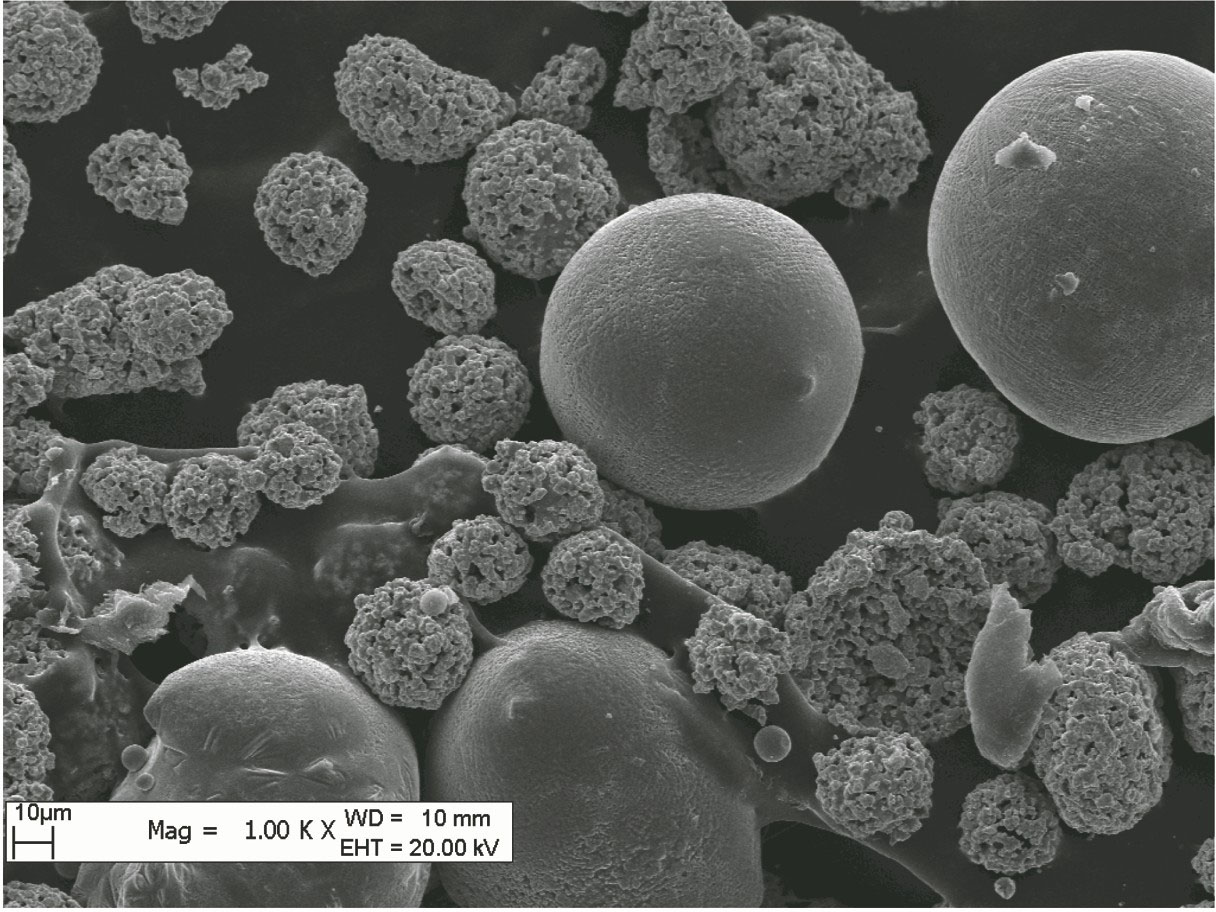
Fig. 1. Ni35WC11 mixed powder
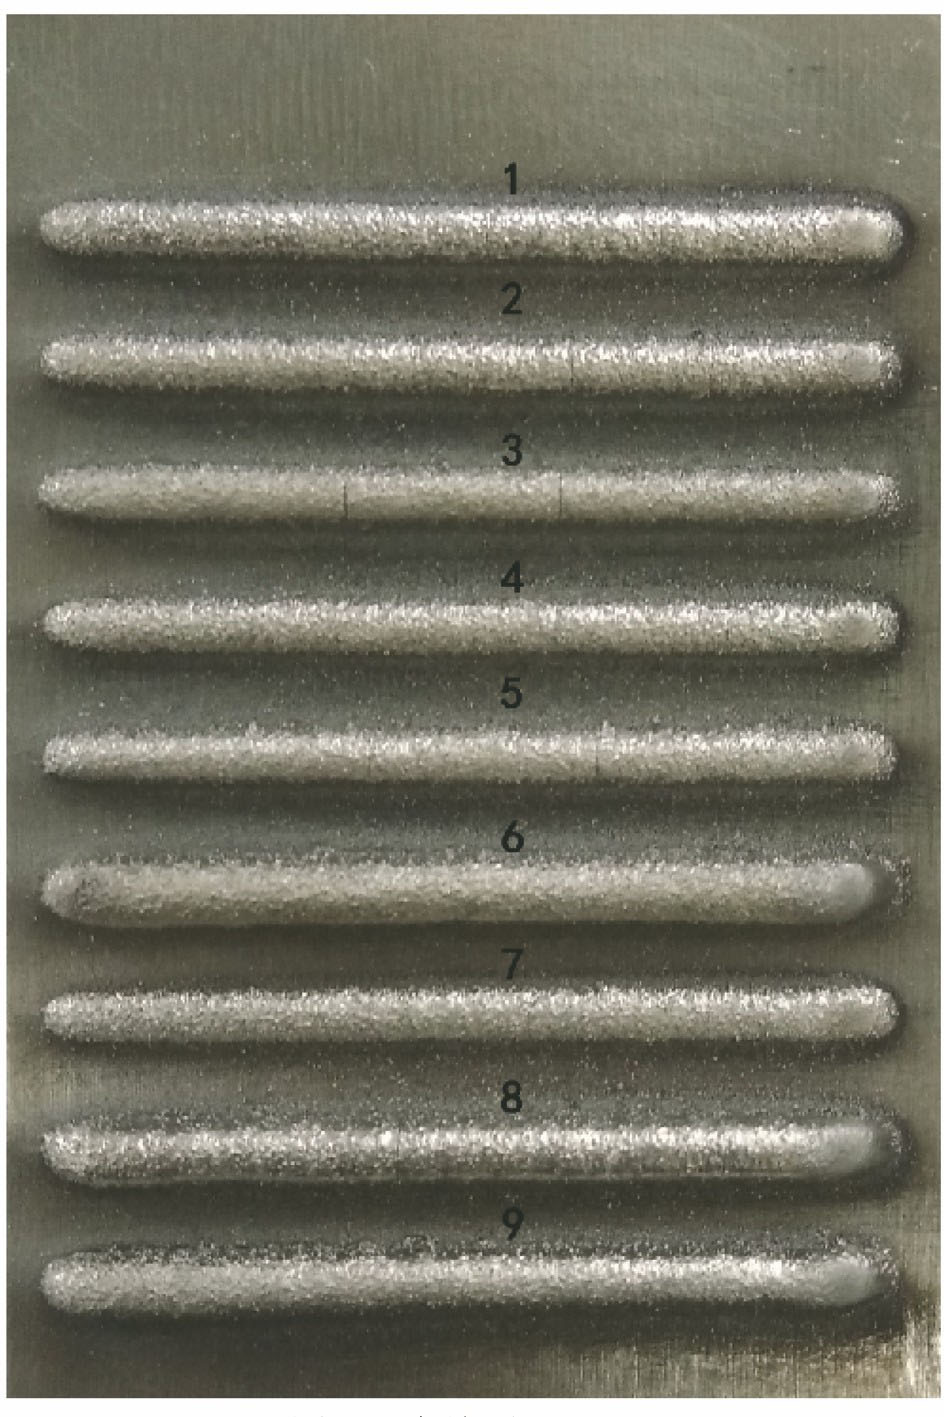
Fig. 2. Orthogonal cladding layer
Fig. 3. Influence of factors on cladding layer width
Fig. 4. Influence of factors on cladding layer height
Fig. 5. Measurement methods of cladding layer width, height and pool depth
Fig. 6. Influence of factors on dilution rate of cladding layer
Fig. 7. Hardness value from cladding layer to substrate
Fig. 8. Microstructure. (a) Cladding layer; (b) heat affected zone; (c) substrate
Fig. 9. Electrification curves of cladding layer and substrate
Sample | Laser power /W | Feeding rate /(g·s-1) | Scanning speed /(mm·s-1) | Spot diameter /mm |
---|
1 | 900 | 2 | 4 | 2 | 2 | 1100 | 2 | 4 | 2 | 3 | 1300 | 2 | 4 | 2 | 4 | 1500 | 2 | 4 | 2 | 5 | 1600 | 2 | 4 | 2 | 6 | 1500 | 1 | 4 | 2 | 7 | 1500 | 3 | 4 | 2 | 8 | 1500 | 2 | 3 | 2 | 9 | 1500 | 2 | 5 | 2 |
|
Table 1. Single factor experimental parameters
Factor | Laserpower /W | Feedingrate /(g·s-1) | Scanningspeed /(mm·s-1) |
---|
Level 1 | 1400 | 1.8 | 3.5 | Level 2 | 1500 | 2.0 | 4.0 | Level 3 | 1600 | 2.2 | 4.5 |
|
Table 2. Level table of experimental factor
Sample | Factor A | Factor B | Factor C | Width /mm | Height /mm | Rate of dilution /% |
---|
1 | 1 | 1 | 1 | 3.5 | 1.7 | 14 | 2 | 1 | 2 | 2 | 3.4 | 2.1 | 6 | 3 | 1 | 3 | 3 | 3.6 | 2.3 | 7 | 4 | 2 | 1 | 2 | 3.4 | 1.6 | 12 | 5 | 2 | 2 | 3 | 3.3 | 2.2 | 11 | 6 | 2 | 3 | 1 | 4.4 | 3.3 | 4 | 7 | 3 | 1 | 3 | 3.2 | 1.4 | 19 | 8 | 3 | 2 | 1 | 4.1 | 2.9 | 6 | 9 | 3 | 3 | 2 | 3.9 | 2.7 | 6 |
|
Table 3. Orthogonal combination and test indicators
Target | Statisticaverage | Factor A | Factor B | Factor C |
---|
| K1 | 10.5 | 10.1 | 12.0 | | K2 | 11.1 | 10.8 | 10.7 | | K3 | 11.2 | 11.9 | 10.1 | Width | k1 | 3.5 | 3.4 | 4.0 | | k2 | 3.7 | 3.6 | 3.6 | | k3 | 3.7 | 4.0 | 3.4 | | R | 0.2 | 0.6 | 0.6 |
|
Table 4. Range of widthunit: mm
Target | Statisticaverage | Factor A | Factor B | Factor C |
---|
| K1 | 6.1 | 4.7 | 7.9 | | K2 | 7.1 | 7.2 | 6.4 | | K3 | 7.0 | 8.3 | 5.9 | Height | k1 | 2.0 | 1.6 | 2.6 | | k2 | 2.4 | 2.4 | 2.1 | | k3 | 2.3 | 2.8 | 2.0 | | R | 0.4 | 1.2 | 0.6 |
|
Table 5. Range of heightunit: mm
Target | Statisticaverage | Factor A | Factor B | Factor C |
---|
| K1 | 27.0 | 45.0 | 24.0 | | K2 | 27.0 | 23.0 | 24.0 | | K3 | 31.0 | 17.0 | 37.0 | Dilutionrate | k1 | 9.0 | 15.0 | 8.0 | | k2 | 9.0 | 7.6 | 8.0 | | k3 | 10.3 | 5.6 | 12.3 | | R | 1.3 | 9.4 | 4.3 |
|
Table 6. Range of dilution rateunit: %