• Acta Optica Sinica
  • Vol. 41, Issue 17, 1730003 (2021)
Sheng Rong1, Hongshuang Liu1, Ying Zhong2, and Haitao Liu1、*
Author Affiliations
  • 1Tianjin Key Laboratory of Micro-Scale Optical Information Science and Technology, Institute of Modern Optics, College of Electronic Information and Optical Engineering, Nankai University, Tianjin 300350, China
  • 2State Key Laboratory of Precision Measurement Technology and Instruments, School of Precision Instrument and Opto-Electronics Engineering, Tianjin University, Tianjin 300072, China
  • show less
    DOI: 10.3788/AOS202141.1730003 Cite this Article Set citation alerts
    Sheng Rong, Hongshuang Liu, Ying Zhong, Haitao Liu. Enhancement of Raman Spectra Based on Optical Trapping of Gold Nanocubes[J]. Acta Optica Sinica, 2021, 41(17): 1730003 Copy Citation Text show less
    Schematic diagrams of experimental system and sample. (a) Schematic diagram of experimental system, L1, L2: beam expanding lens, F1: excitation filter, F2: emission filter, DBS: dichroic mirror, BS: beam splitter, L3, L4: focusing lens; (b) structure of sample chamber; (c) SEM image of gold nanocubes; (d) SEM image of gold nanospheres
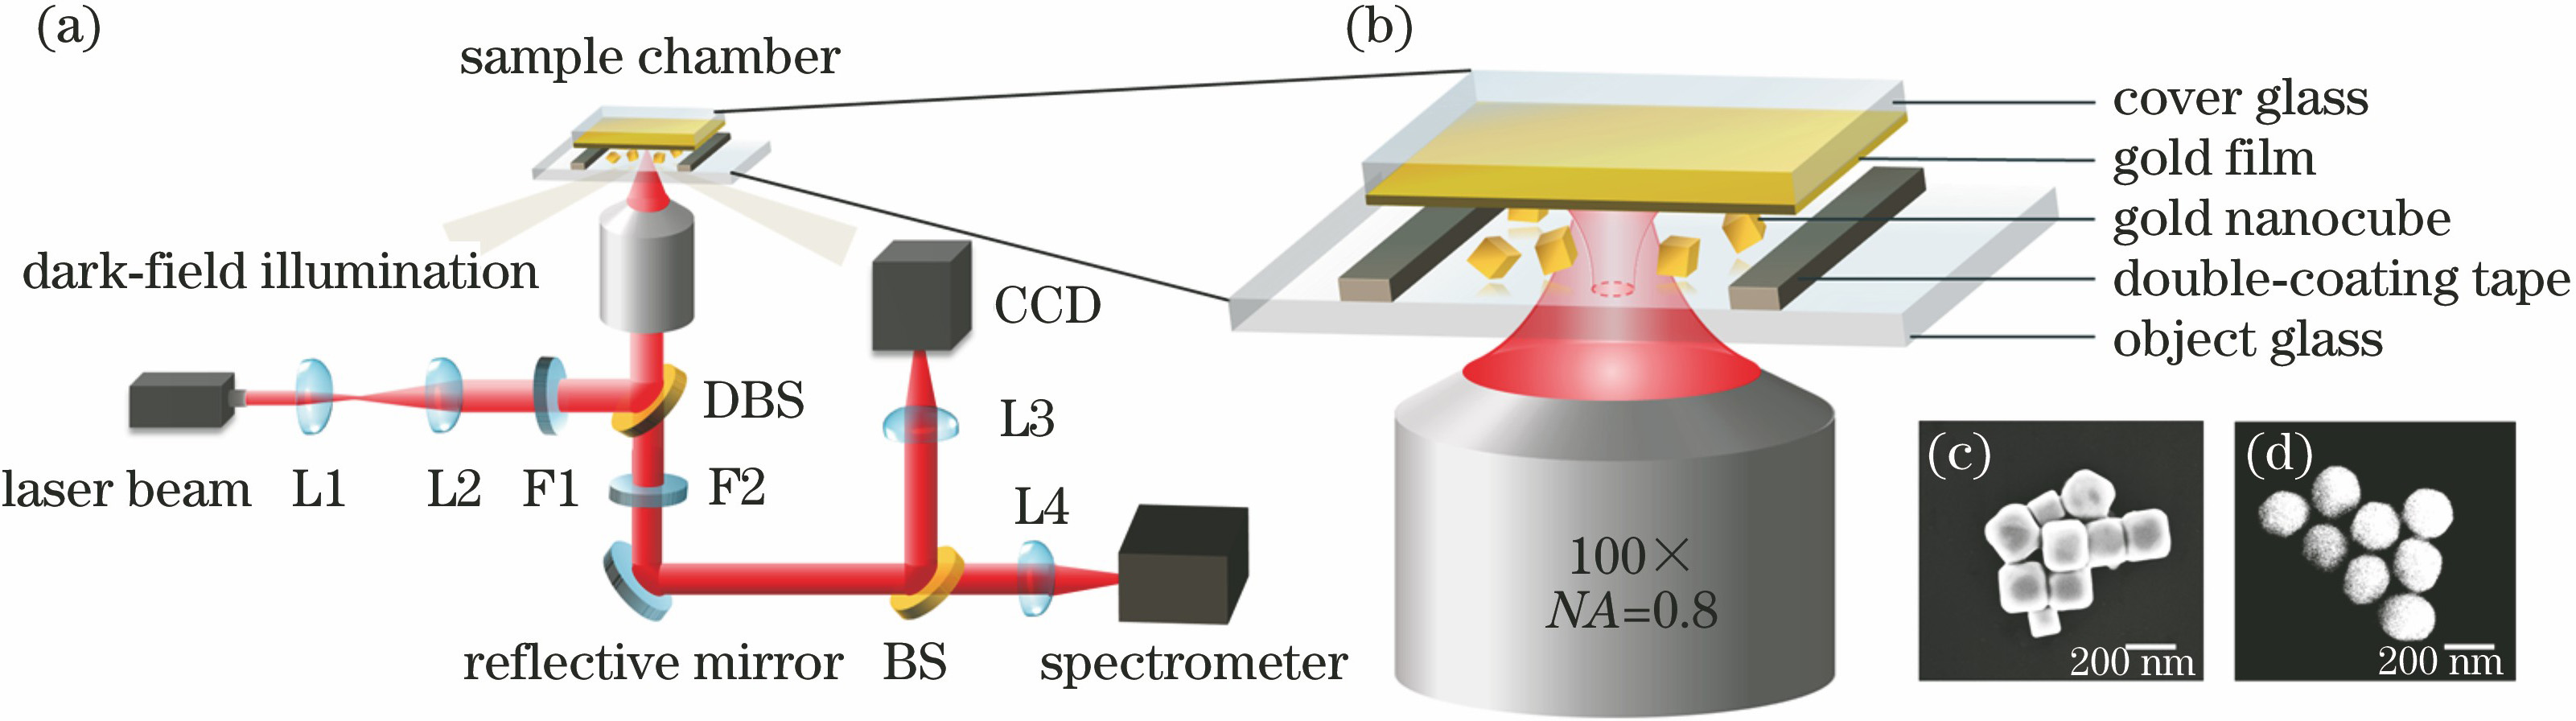
    Fig. 1. Schematic diagrams of experimental system and sample. (a) Schematic diagram of experimental system, L1, L2: beam expanding lens, F1: excitation filter, F2: emission filter, DBS: dichroic mirror, BS: beam splitter, L3, L4: focusing lens; (b) structure of sample chamber; (c) SEM image of gold nanocubes; (d) SEM image of gold nanospheres
    Dark field imaging of gold nanoparticles trapped by laser (scale bar is 5 μm). Arrow represents the position of the focal spot, circles represent gold nanoparticles. (a1)--(a5) Dark field imaging of gold nanocubes trapped by laser; (b1)--(b5) dark field imaging of gold nanospheres trapped by laser
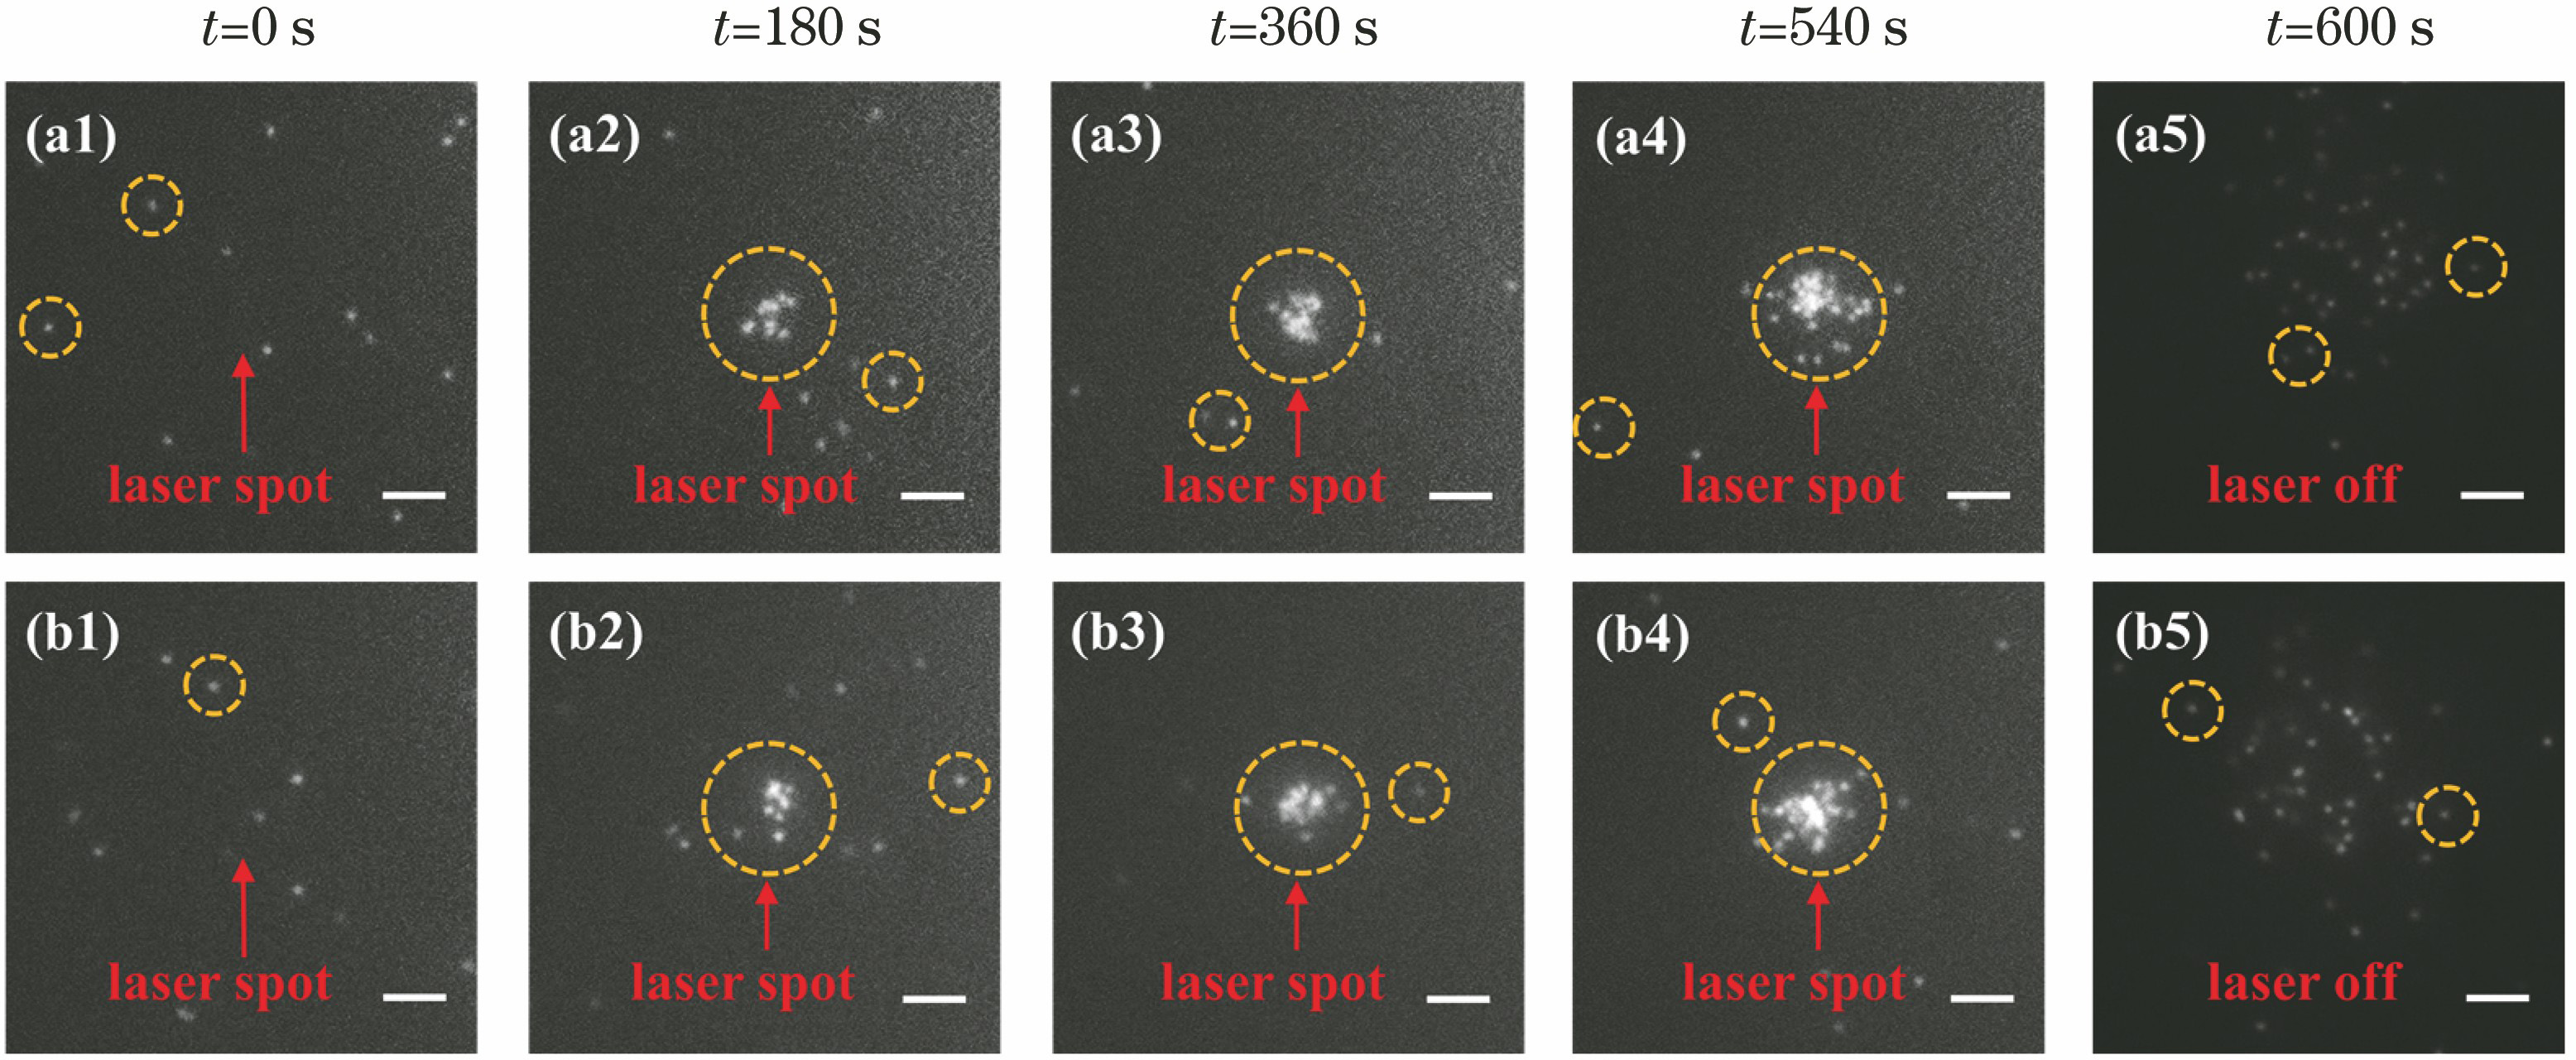
    Fig. 2. Dark field imaging of gold nanoparticles trapped by laser (scale bar is 5 μm). Arrow represents the position of the focal spot, circles represent gold nanoparticles. (a1)--(a5) Dark field imaging of gold nanocubes trapped by laser; (b1)--(b5) dark field imaging of gold nanospheres trapped by laser
    Raman signal intensities in different kinds of aqueous solution at different times. Raman spectra of 4-MBA in (a1) aqueous solution of gold nanocubes and (a2) aqueous solution of gold nanospheres; Raman spectra of 4-MBA in (b1) aqueous solution of gold nanocubes and (b2) aqueous solution of gold nanospheres at initial time, where vertical dashed lines make positions of two Raman characteristic peaks and their corrsponding Raman shifts are 1078 cm-1 and 1594 cm-1, respectively
    Fig. 3. Raman signal intensities in different kinds of aqueous solution at different times. Raman spectra of 4-MBA in (a1) aqueous solution of gold nanocubes and (a2) aqueous solution of gold nanospheres; Raman spectra of 4-MBA in (b1) aqueous solution of gold nanocubes and (b2) aqueous solution of gold nanospheres at initial time, where vertical dashed lines make positions of two Raman characteristic peaks and their corrsponding Raman shifts are 1078 cm-1 and 1594 cm-1, respectively
    Raman signal (Raman shift is 1078 cm-1) intensitis of 4-MBA in solutions of gold nanocubes and gold nanospheres vary with time after laser is turned on
    Fig. 4. Raman signal (Raman shift is 1078 cm-1) intensitis of 4-MBA in solutions of gold nanocubes and gold nanospheres vary with time after laser is turned on
    Optical forces on particles in two typical states. When electric field E (along the y-direction) is parallel to (a1) side or (b1) diagonal of gold nanocube,for y=0, (a2)(b2) relationship between Fx(x) and x (dot line), (a3)、(b3) relationship between Fz(x) and x (dot line); for x=0, (a2)(b2) relationship between Fy(y) and y (diamond line), (a3)(b3) relationship between Fz(y) and y (diamond line); (a4) (b4) relationship between Fx and D (dot line) when the center of gold nanocube is located at x=200 nm and y=0, relationship between Fy and D (diamond line) when the center of gold nanocube is located at x=0 and y=200 nm, and relationship between Fz and D (triangle line) when the center of gold nanocube is located at x=0 and y=0
    Fig. 5. Optical forces on particles in two typical states. When electric field E (along the y-direction) is parallel to (a1) side or (b1) diagonal of gold nanocube,for y=0, (a2)(b2) relationship between Fx(x) and x (dot line), (a3)、(b3) relationship between Fz(x) and x (dot line); for x=0, (a2)(b2) relationship between Fy(y) and y (diamond line), (a3)(b3) relationship between Fz(y) and y (diamond line); (a4) (b4) relationship between Fx and D (dot line) when the center of gold nanocube is located at x=200 nm and y=0, relationship between Fy and D (diamond line) when the center of gold nanocube is located at x=0 and y=200 nm, and relationship between Fz and D (triangle line) when the center of gold nanocube is located at x=0 and y=0
    Velocity distributions of photothermal convection in cavity caused by aggregated gold nanocubes, arrows indicate directions of velocity. (a) Side view; (b) top view
    Fig. 6. Velocity distributions of photothermal convection in cavity caused by aggregated gold nanocubes, arrows indicate directions of velocity. (a) Side view; (b) top view
    Distributions of f for different numbers of nanoparticles on x-y plane. (a1)--(a3) Distributions of f for single particle; (b1)--(b3) distributions of f for two particles; (c1)--(c3) distributions of f for 9 gold nanospheres; (d1)--(d3) distributions of f for 9 gold nanocubes
    Fig. 7. Distributions of f for different numbers of nanoparticles on x-y plane. (a1)--(a3) Distributions of f for single particle; (b1)--(b3) distributions of f for two particles; (c1)--(c3) distributions of f for 9 gold nanospheres; (d1)--(d3) distributions of f for 9 gold nanocubes
    fSERS for different metal structures. fSERS for different numbers of gold nanocubes and nanospheres. Data in dotted box are the results for the case that number of particles increases gradually while arrangement of particles with the previous number remains unchanged; (b) fSERS corresponding to two gold nanocubes with typical structure of "edge close to surface" as shown in Fig. 7(b2) under different g. Inset shows schematic of simulated structure, where the electric field E of incident light beam is along the y-direction. Horizontal dashed line represents the sum of fSERS of two single gold nanocubes (one of them is diagonal parallel to E and the other is edge parallel to E)
    Fig. 8. fSERS for different metal structures. fSERS for different numbers of gold nanocubes and nanospheres. Data in dotted box are the results for the case that number of particles increases gradually while arrangement of particles with the previous number remains unchanged; (b) fSERS corresponding to two gold nanocubes with typical structure of "edge close to surface" as shown in Fig. 7(b2) under different g. Inset shows schematic of simulated structure, where the electric field E of incident light beam is along the y-direction. Horizontal dashed line represents the sum of fSERS of two single gold nanocubes (one of them is diagonal parallel to E and the other is edge parallel to E)
    Raman enhancement factor fSERS for different M when g=20 nm. Circular curve and rectangular curve correspond to structure with two gold nanospheres and structure with two gold nanocubes, respectively (electric field E of incident laser along the y-direction). Ordinate value of circular curve is magnified 5 times to show the details
    Fig. 9. Raman enhancement factor fSERS for different M when g=20 nm. Circular curve and rectangular curve correspond to structure with two gold nanospheres and structure with two gold nanocubes, respectively (electric field E of incident laser along the y-direction). Ordinate value of circular curve is magnified 5 times to show the details
    Sheng Rong, Hongshuang Liu, Ying Zhong, Haitao Liu. Enhancement of Raman Spectra Based on Optical Trapping of Gold Nanocubes[J]. Acta Optica Sinica, 2021, 41(17): 1730003
    Download Citation