Author Affiliations
1 National Satellite Meteorological Center, China Meteorological Administration, Beijing 100081, China2 Key Laboratory of Radiometric Calibration and Validation for Environmental Satellites, China Meteorological Administration, Beijing 100081, Chinashow less
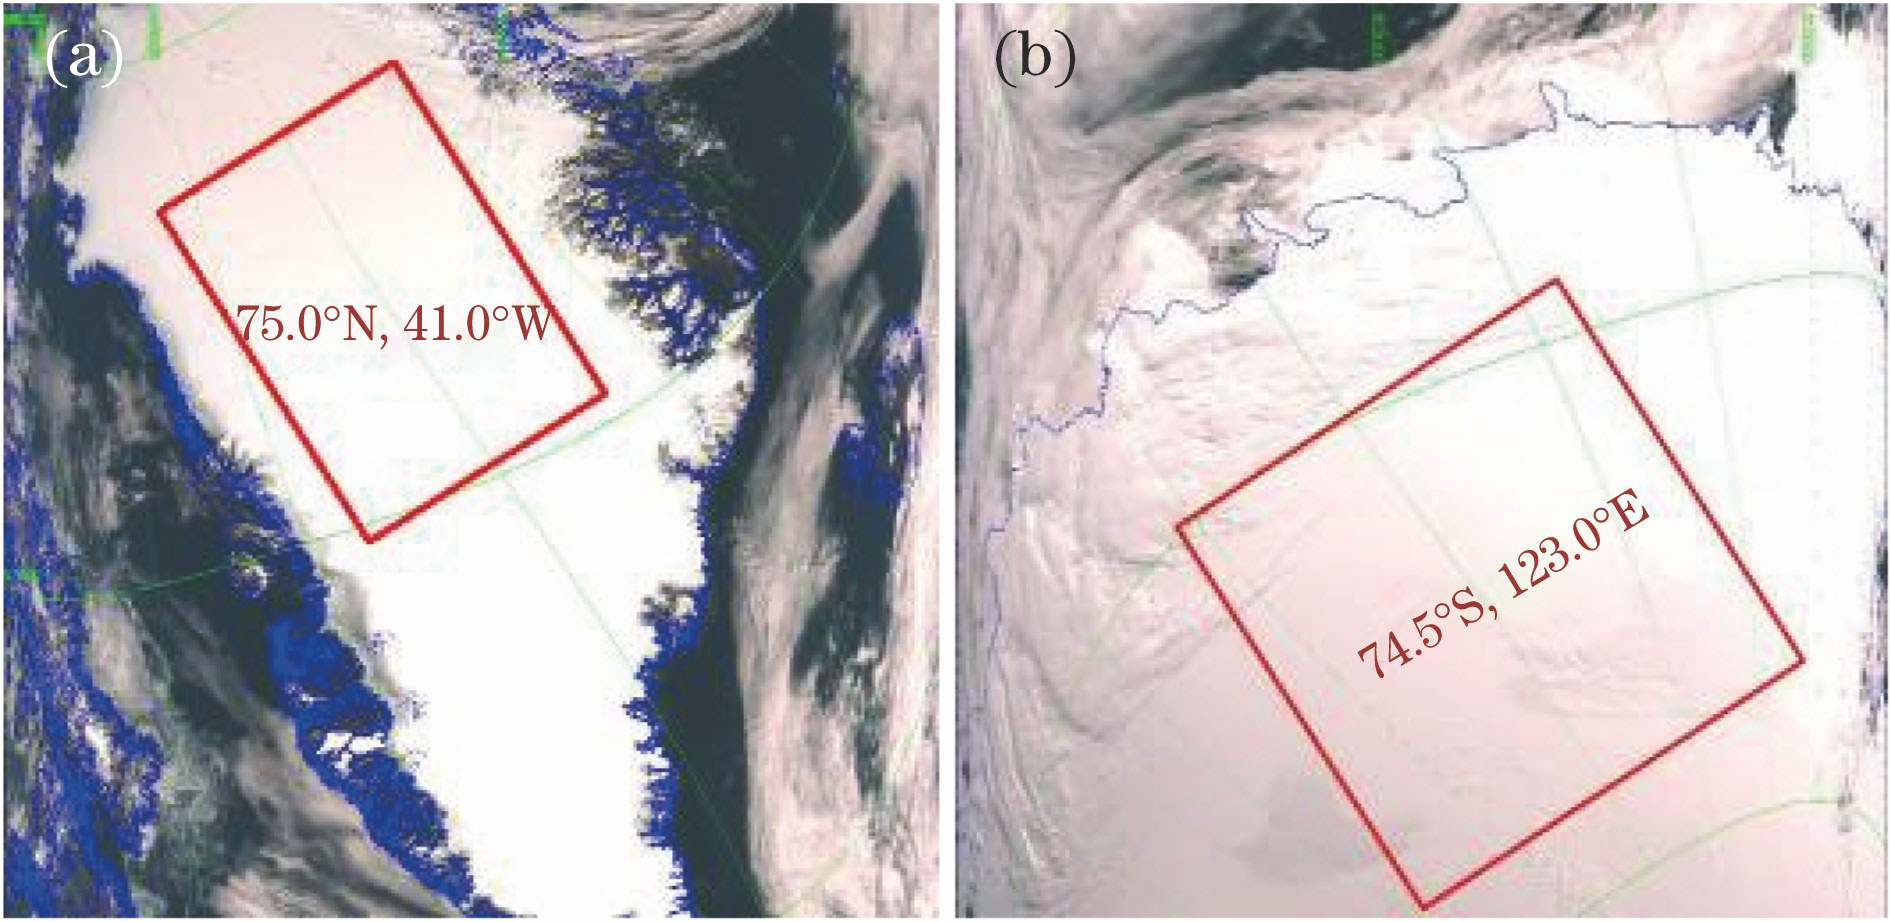
Fig. 1. FY-3A/MERSI RGB images acquired over snow targets in south and north poles. (a) Greenland; (b) Dome C
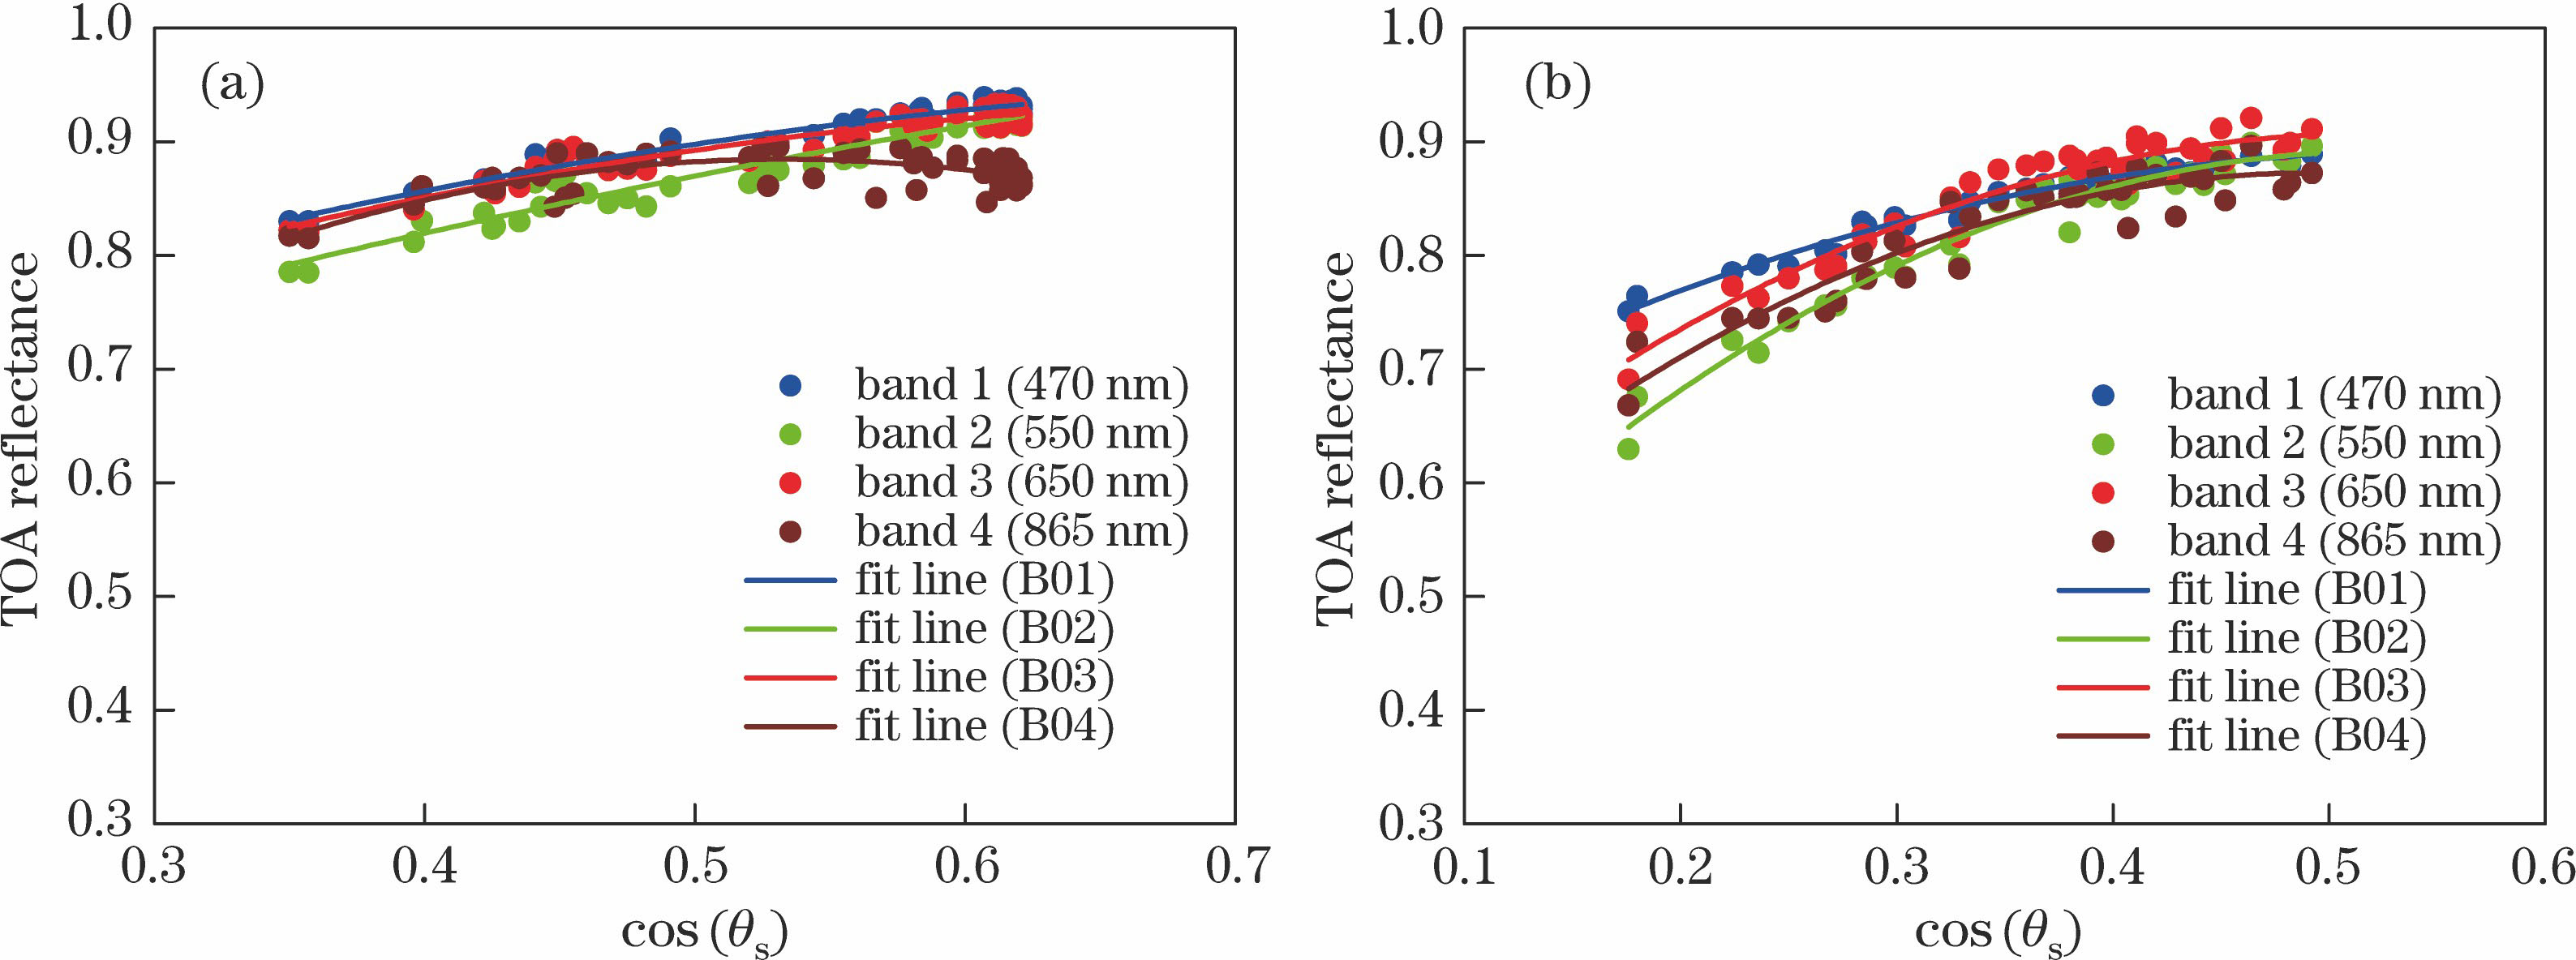
Fig. 2. Quadratic polynomial BRDF regression models of (a) Greenland and (b) Dome C based on TOA data of FY-3A/MERSI from January 2013 to December 2013
Fig. 3. Observed values of TOA, predicted values of BRDF model and ratios of the observed values and predicted values of model for FY-3A/MERSI over Greenland. (a) Band 1; (b) band 2; (c) band 3; (d) band 4
Fig. 4. Observed values of TOA, predicted values of BRDF model and ratios of the observed values and predicted values of model for FY-3A/MERSI over Dome C. (a) Band 1; (b) band 2; (c) band 3; (d) band 4
Fig. 5. Time series and radiometric response degradation tracking results of normalized TOA of FY-3A/MERSI over Greenland and Dome C snow target. (a) Band 1; (b) band 2; (c) band 3; (d) band 4
Fig. 6. Time series and radiometric response degradation tracking results of normalized TOA of FY-3A/MERSI band 8 over Greenland and Dome C snow target
Fig. 7. Total degradation rate of reflected solar channel of FY-3A/MERSI from August 2008 to August 2012 derived from four different methods
| Band | CW /μm | BW /μm | NEΔ ρ /% | Dynamic range | Band | CW /μm | BW /μm | NEΔ ρ /% | Dynamic range |
|---|
| 1 | 0.470 | 0.05 | 0.43 | 100% | 11 | 0.520 | 0.02 | 0.05 | 80% | | 2 | 0.550 | 0.05 | 0.43 | 100% | 12 | 0.565 | 0.02 | 0.05 | 80% | | 3 | 0.650 | 0.05 | 0.43 | 100% | 13 | 0.650 | 0.02 | 0.05 | 80% | | 4 | 0.865 | 0.05 | 0.43 | 100% | 14 | 0.685 | 0.02 | 0.05 | 80% | | 5 | 11.25 | 2.5 | 0.4 | 330K | 15 | 0.765 | 0.02 | 0.05 | 80% | | 6 | 1.640 | 0.05 | 0.08 | 90% | 16 | 0.865 | 0.02 | 0.05 | 80% | | 7 | 2.130 | 0.05 | 0.07 | 90% | 17 | 0.905 | 0.02 | 0.1 | 90% | | 8 | 0.412 | 0.02 | 0.1 | 80% | 18 | 0.940 | 0.02 | 0.1 | 90% | | 9 | 0.443 | 0.02 | 0.1 | 80% | 19 | 0.980 | 0.02 | 0.1 | 90% | | 10 | 0.490 | 0.02 | 0.05 | 80% | 20 | 1.030 | 0.02 | 0.1 | 90% | | Note: CW is central wavelength, BW is band width, NEΔ ρ is signal-to-noise ratio,bands 1-5 with a spatial resolution of 500 m, bands 6-20 with a spatial resolution of 1000 m. | |
|
Table 1. FY-3A/MERSI spectral band specifications
| Band | Greenland | Dome C |
|---|
| k2 | k1 | k0 | RMSE | R2 | | k2 | k1 | k0 | RMSE | R2 |
|---|
| 1 | -0.5552 | 0.9113 | 0.5809 | 0.0063 | 0.953 | -0.9883 | 1.0929 | 0.5899 | 0.0058 | 0.975 | | 2 | -0.2985 | 0.7713 | 0.5587 | 0.0099 | 0.936 | -1.9993 | 2.0961 | 0.3422 | 0.0124 | 0.963 | | 3 | -0.6748 | 1.0214 | 0.5504 | 0.0084 | 0.913 | -1.6637 | 1.7364 | 0.4542 | 0.0142 | 0.930 | | 4 | -2.0483 | 2.1817 | 0.3036 | 0.0122 | 0.538 | -1.8850 | 1.8597 | 0.4138 | 0.0173 | 0.893 | | 8 | -0.4440 | 0.7431 | 0.5240 | 0.0061 | 0.938 | -0.4636 | 0.7186 | 0.5415 | 0.0123 | 0.883 | | 9 | -0.4242 | 0.6898 | 0.5801 | 0.0048 | 0.950 | -0.4557 | 0.6564 | 0.5957 | 0.0145 | 0.802 | | 10 | -0.4425 | 0.7627 | 0.6334 | 0.0045 | 0.969 | -0.8980 | 1.0450 | 0.6052 | 0.0058 | 0.975 | | 11 | -0.4214 | 0.7650 | 0.6345 | 0.0065 | 0.945 | -1.4023 | 1.4880 | 0.5266 | 0.0077 | 0.973 | | 12 | -0.1189 | 0.5081 | 0.5860 | 0.0108 | 0.894 | -1.7994 | 1.8458 | 0.3613 | 0.0139 | 0.937 | | 13 | -0.8165 | 1.0983 | 0.5340 | 0.0069 | 0.910 | -1.7883 | 1.7971 | 0.4418 | 0.0144 | 0.924 | | 14 | -1.0380 | 1.2775 | 0.4902 | 0.0067 | 0.884 | -1.5797 | 1.6080 | 0.4660 | 0.0124 | 0.933 | | 15 | -1.2257 | 1.4491 | 0.3379 | 0.0070 | 0.860 | -1.3203 | 1.4067 | 0.3846 | 0.0109 | 0.941 | | 16 | -1.8061 | 1.9063 | 0.3751 | 0.0112 | 0.588 | -1.5385 | 1.5638 | 0.4704 | 0.0146 | 0.903 | | 17 | -2.3517 | 2.2946 | 0.2616 | 0.0225 | 0.314 | -1.8884 | 1.6466 | 0.4659 | 0.0202 | 0.731 | | 18 | -3.3217 | 3.1006 | -0.1976 | 0.0365 | 0.391 | -2.0034 | 1.5659 | 0.2472 | 0.0226 | 0.499 | | 19 | -2.4339 | 2.2978 | 0.2264 | 0.0237 | 0.415 | -1.7180 | 1.4790 | 0.4475 | 0.0191 | 0.696 | | 20 | -1.9092 | 1.7594 | 0.2845 | 0.0232 | 0.689 | -2.0632 | 1.7159 | 0.3160 | 0.0122 | 0.827 |
|
Table 2. TOA BRDF model parameters and model error estimation for Greenland and Dome C
| Band | Wavelength /nm | a2 | a1 | a0 | 2σ/Vmean | Annual drift /% | Total drift /% |
|---|
| 1 | 470 | 4.52×10⁻⁸ | -1.95×10⁻⁴ | 1.2010 | 1.67 | 2.69 | 17.39 | | 2 | 550 | 2.67×10⁻⁸ | -1.03×10⁻⁴ | 1.0964 | 2.73 | 1.32 | 8.54 | | 3 | 650 | 6.64×10⁻⁹ | -2.94×10⁻⁶ | 0.9800 | 2.04 | -0.47 | -3.06 | | 4 | 865 | 1.19×10⁻⁸ | -3.66×10⁻⁵ | 1.0267 | 2.55 | 0.37 | 2.24 | | 8 | 412 | 1.23×10⁻⁷ | -6.17×10⁻⁴ | 1.7230 | 2.05 | 6.95 | 44.83 | | 9 | 443 | 1.97×10⁻⁸ | -2.22×10⁻⁴ | 1.3416 | 1.52 | 4.77 | 30.79 | | 10 | 490 | 2.63×10⁻⁸ | -1.33×10⁻⁴ | 1.1502 | 1.35 | 2.25 | 14.49 | | 11 | 520 | 2.12×10⁻⁸ | -8.93×10⁻⁵ | 1.0875 | 1.79 | 1.32 | 8.52 | | 12 | 565 | 1.45×10⁻⁸ | -4.56×10⁻⁵ | 1.0300 | 2.82 | 0.41 | 2.62 | | 13 | 650 | 7.54×10⁻⁹ | -9.77×10⁻⁶ | 0.9890 | 2.18 | -0.30 | -1.91 | | 14 | 685 | 9.57×10⁻⁹ | -1.28×10⁻⁵ | 0.9886 | 2.03 | -0.36 | -2.34 | | 15 | 765 | 1.36×10⁻⁸ | -3.59×10⁻⁵ | 1.0172 | 2.04 | 0.14 | 0.89 | | 16 | 865 | 3.88×10⁻¹⁰ | -1.22×10⁻⁵ | 1.0214 | 2.36 | 0.40 | 2.61 | | 17 | 905 | 2.24×10⁻⁸ | -7.87×10⁻⁵ | 1.0633 | 3.62 | 0.89 | 5.74 | | 18 | 940 | 2.60×10⁻⁸ | -1.11×10⁻⁴ | 1.1015 | 9.29 | 1.65 | 10.64 | | 19 | 980 | 1.53×10⁻⁸ | -9.56×10⁻⁵ | 1.1191 | 3.98 | 1.94 | 12.52 | | 20 | 1030 | 4.97×10⁻⁹ | -1.39×10⁻⁴ | 1.2385 | 4.90 | 3.75 | 24.19 |
|
Table 3. FY-3A/MERSI radiometric response tracking model parameters derived from RTOA time series from June 2008 to December 2014 over Greenland and Dome C, model uncertainty statistics and calculated radiomet
| Band | Degradation /% | Degradation difference /% |
|---|
| Snow | DCC | Multi-site | Dunhuang | | Snow/DCC | Snow/multi-site | Snow/Dunhuang |
|---|
| 1 | 15.72 | 14.48 | 18.18 | 14.44 | 1.24 | -2.46 | 1.28 | | 2 | 8.06 | 5.79 | 9.12 | 5.67 | 2.27 | -1.06 | 2.39 | | 3 | -1.30 | -2.44 | -2.46 | 0.83 | 1.14 | 1.16 | -2.13 | | 4 | 2.97 | 0.52 | -0.31 | 2.14 | 2.45 | 3.28 | 0.83 | | 8 | 37.63 | 37.87 | 38.08 | 36.76 | -0.23 | -0.45 | 0.87 | | 9 | 20.84 | 20.89 | 23.94 | 30.65 | -0.05 | -3.10 | -9.81 | | 10 | 11.92 | 11.41 | 15.67 | 10.74 | 0.51 | -3.75 | 1.18 | | 11 | 7.50 | 2.59 | 12.04 | 8.57 | 4.91 | -4.54 | -1.07 | | 12 | 2.84 | 2.48 | 6.00 | 3.75 | 0.37 | -3.16 | -0.91 | | 13 | -0.61 | -1.87 | -1.32 | 0.45 | 1.26 | 0.71 | -1.06 | | 14 | -0.44 | -1.60 | -1.59 | 1.43 | 1.16 | 1.15 | -1.87 | | 15 | 2.30 | 1.59 | 1.81 | 1.79 | 0.71 | 0.49 | 0.51 | | 16 | 1.58 | -0.21 | 1.21 | 3.81 | 1.79 | 0.37 | -2.23 | | 17 | 6.65 | 5.77 | 7.13 | 4.00 | 0.88 | -0.48 | 2.65 | | 18 | 10.72 | 9.00 | 14.52 | 16.00 | 1.73 | -3.80 | -5.28 | | 19 | 10.05 | 7.84 | 10.18 | 11.92 | 2.21 | -0.13 | -1.87 | | 20 | 15.64 | 15.87 | 16.06 | 17.33 | -0.23 | -0.42 | -1.69 |
|
Table 4. Total degradation rate of reflected solar channel of four methods and deviation of proposed method and other three methods derived from FY-3A/MERSI from August 2008 to August 2012