• Photonics Research
  • Vol. 5, Issue 2, A44 (2017)
Carlo De Santi1、*, Matteo Meneghini1、4, Desiree Monti1, Johannes Glaab2, Martin Guttmann3, Jens Rass2, Sven Einfeldt2, Frank Mehnke3, Johannes Enslin3, Tim Wernicke3, Michael Kneissl2、3, Gaudenzio Meneghesso1, and Enrico Zanoni1
Author Affiliations
  • 1Department of Information Engineering, University of Padova, via Gradenigo 6/B, Padova 35131, Italy
  • 2Ferdinand-Braun-Institut, Leibniz-Institut für Höchstfrequenztechnik, Gustav-Kirchhoff-Str. 4, 12489 Berlin, Germany
  • 3Technische Universität Berlin, Institut für Festkörperphysik, Hardenbergstr. 36, EW 6-1, 10623 Berlin, Germany
  • 4e-mail: matteo.meneghini@dei.unipd.it
  • show less
    DOI: 10.1364/PRJ.5.000A44 Cite this Article Set citation alerts
    Carlo De Santi, Matteo Meneghini, Desiree Monti, Johannes Glaab, Martin Guttmann, Jens Rass, Sven Einfeldt, Frank Mehnke, Johannes Enslin, Tim Wernicke, Michael Kneissl, Gaudenzio Meneghesso, Enrico Zanoni. Recombination mechanisms and thermal droop in AlGaN-based UV-B LEDs[J]. Photonics Research, 2017, 5(2): A44 Copy Citation Text show less
    Spectral distribution of the EL at various temperatures and a current of 1 mA. The four main emission peaks are labeled in the figure.
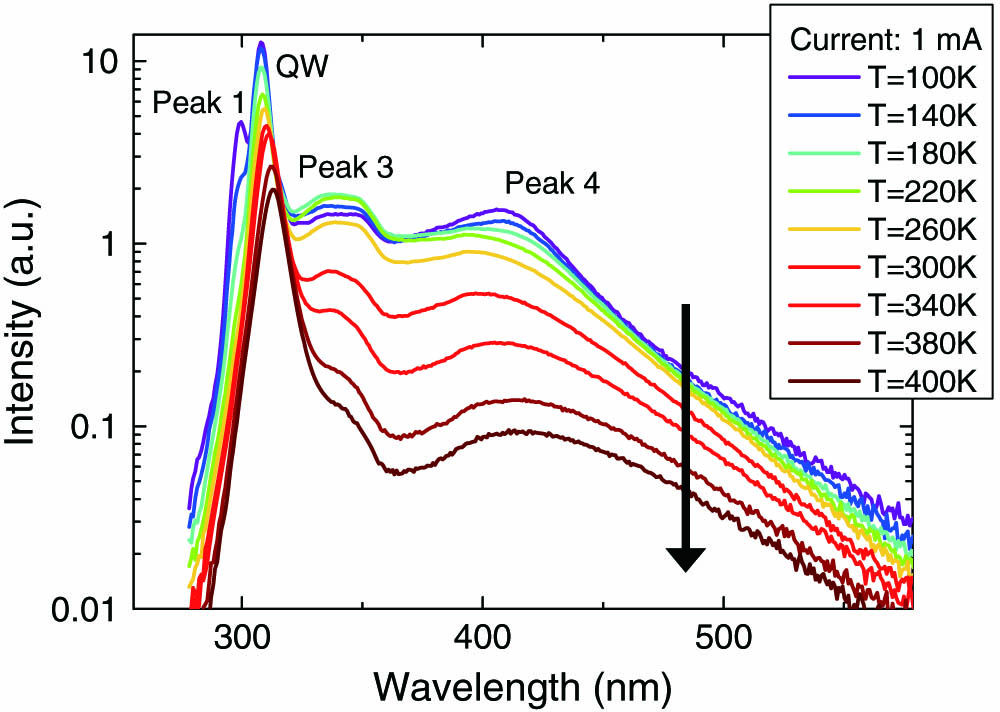
    Fig. 1. Spectral distribution of the EL at various temperatures and a current of 1 mA. The four main emission peaks are labeled in the figure.
    Intensity of the QW emission for different temperatures and currents.
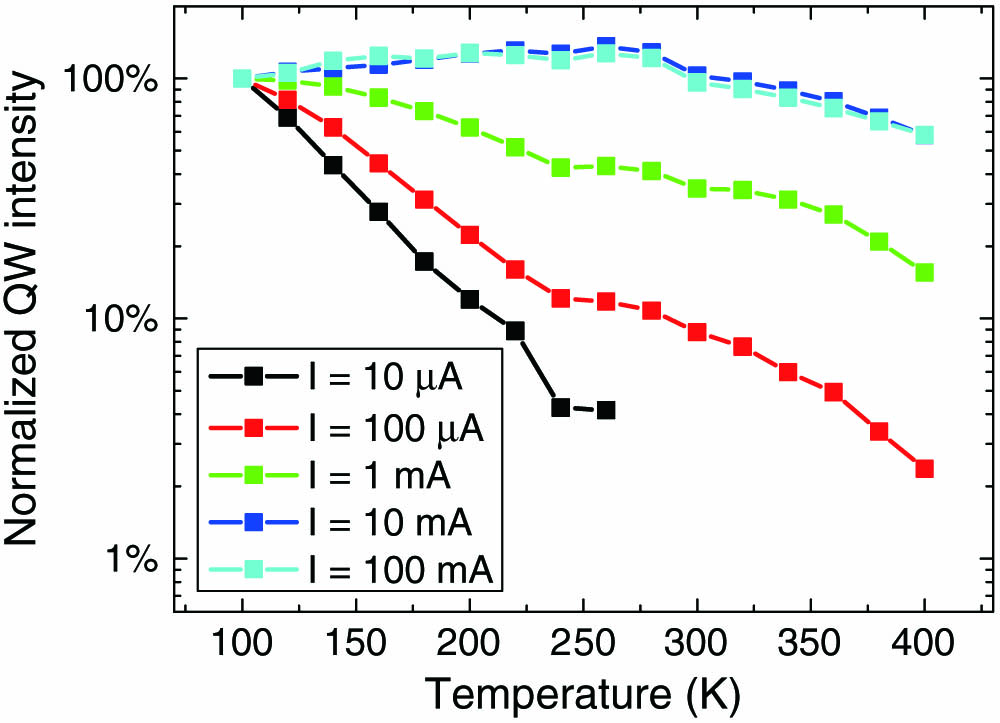
    Fig. 2. Intensity of the QW emission for different temperatures and currents.
    Arrhenius plot of the intensity of the QW emission and fit according to Eq. (1).
    Fig. 3. Arrhenius plot of the intensity of the QW emission and fit according to Eq. (1).
    Temperature dependence of the peak wavelength of the QW emission. Inset: bandgap narrowing with increasing temperature in accordance with Varshni’s law.
    Fig. 4. Temperature dependence of the peak wavelength of the QW emission. Inset: bandgap narrowing with increasing temperature in accordance with Varshni’s law.
    Intensity of the QW emission for different temperatures and currents fitted by Eqs. (3), (7), and (9).
    Fig. 5. Intensity of the QW emission for different temperatures and currents fitted by Eqs. (3), (7), and (9).
    Numerical simulation of the band diagram and of electron and hole concentration at 140 and 300 K at a current of 10 mA.
    Fig. 6. Numerical simulation of the band diagram and of electron and hole concentration at 140 and 300 K at a current of 10 mA.
    Arrhenius plot of the peak 3 intensity for different currents fitted by the complete SRH model [Eqs. (3), (7), and (9)].
    Fig. 7. Arrhenius plot of the peak 3 intensity for different currents fitted by the complete SRH model [Eqs. (3), (7), and (9)].
    Arrhenius plot of the peak 4 intensity for different currents fitted by the complete SRH model [Eq. (7)].
    Fig. 8. Arrhenius plot of the peak 4 intensity for different currents fitted by the complete SRH model [Eq. (7)].
    Intensity of the QW emission at different temperatures fitted by the complete SRH model [Eq. (7)] and the approximated model [Eq. (A3)], respectively.
    Fig. 9. Intensity of the QW emission at different temperatures fitted by the complete SRH model [Eq. (7)] and the approximated model [Eq. (A3)], respectively.
    Carlo De Santi, Matteo Meneghini, Desiree Monti, Johannes Glaab, Martin Guttmann, Jens Rass, Sven Einfeldt, Frank Mehnke, Johannes Enslin, Tim Wernicke, Michael Kneissl, Gaudenzio Meneghesso, Enrico Zanoni. Recombination mechanisms and thermal droop in AlGaN-based UV-B LEDs[J]. Photonics Research, 2017, 5(2): A44
    Download Citation