• Laser & Optoelectronics Progress
  • Vol. 57, Issue 8, 081018 (2020)
Jun Yang1、*, Bo Pan2, Li Chen1, Yongan Zhu1, Tao Jiang1, and Chen Cui3
Author Affiliations
  • 1College of Mathematics Physics and Information Engineering, Jiaxing University, Jiaxing, Zhejiang 314001, China
  • 2Jiaxing Guodiantong New Energy Technology Co. LTD., Jiaxing, Zhejiang 314001, China
  • 3School of Data Science and Technology, Heilongjiang University, Harbin, Heilongjiang 150080, China
  • show less
    DOI: 10.3788/LOP57.081018 Cite this Article Set citation alerts
    Jun Yang, Bo Pan, Li Chen, Yongan Zhu, Tao Jiang, Chen Cui. Image Edge Information Aided Compressive Sampling Strategy[J]. Laser & Optoelectronics Progress, 2020, 57(8): 081018 Copy Citation Text show less
    Schematic for the ASR framework
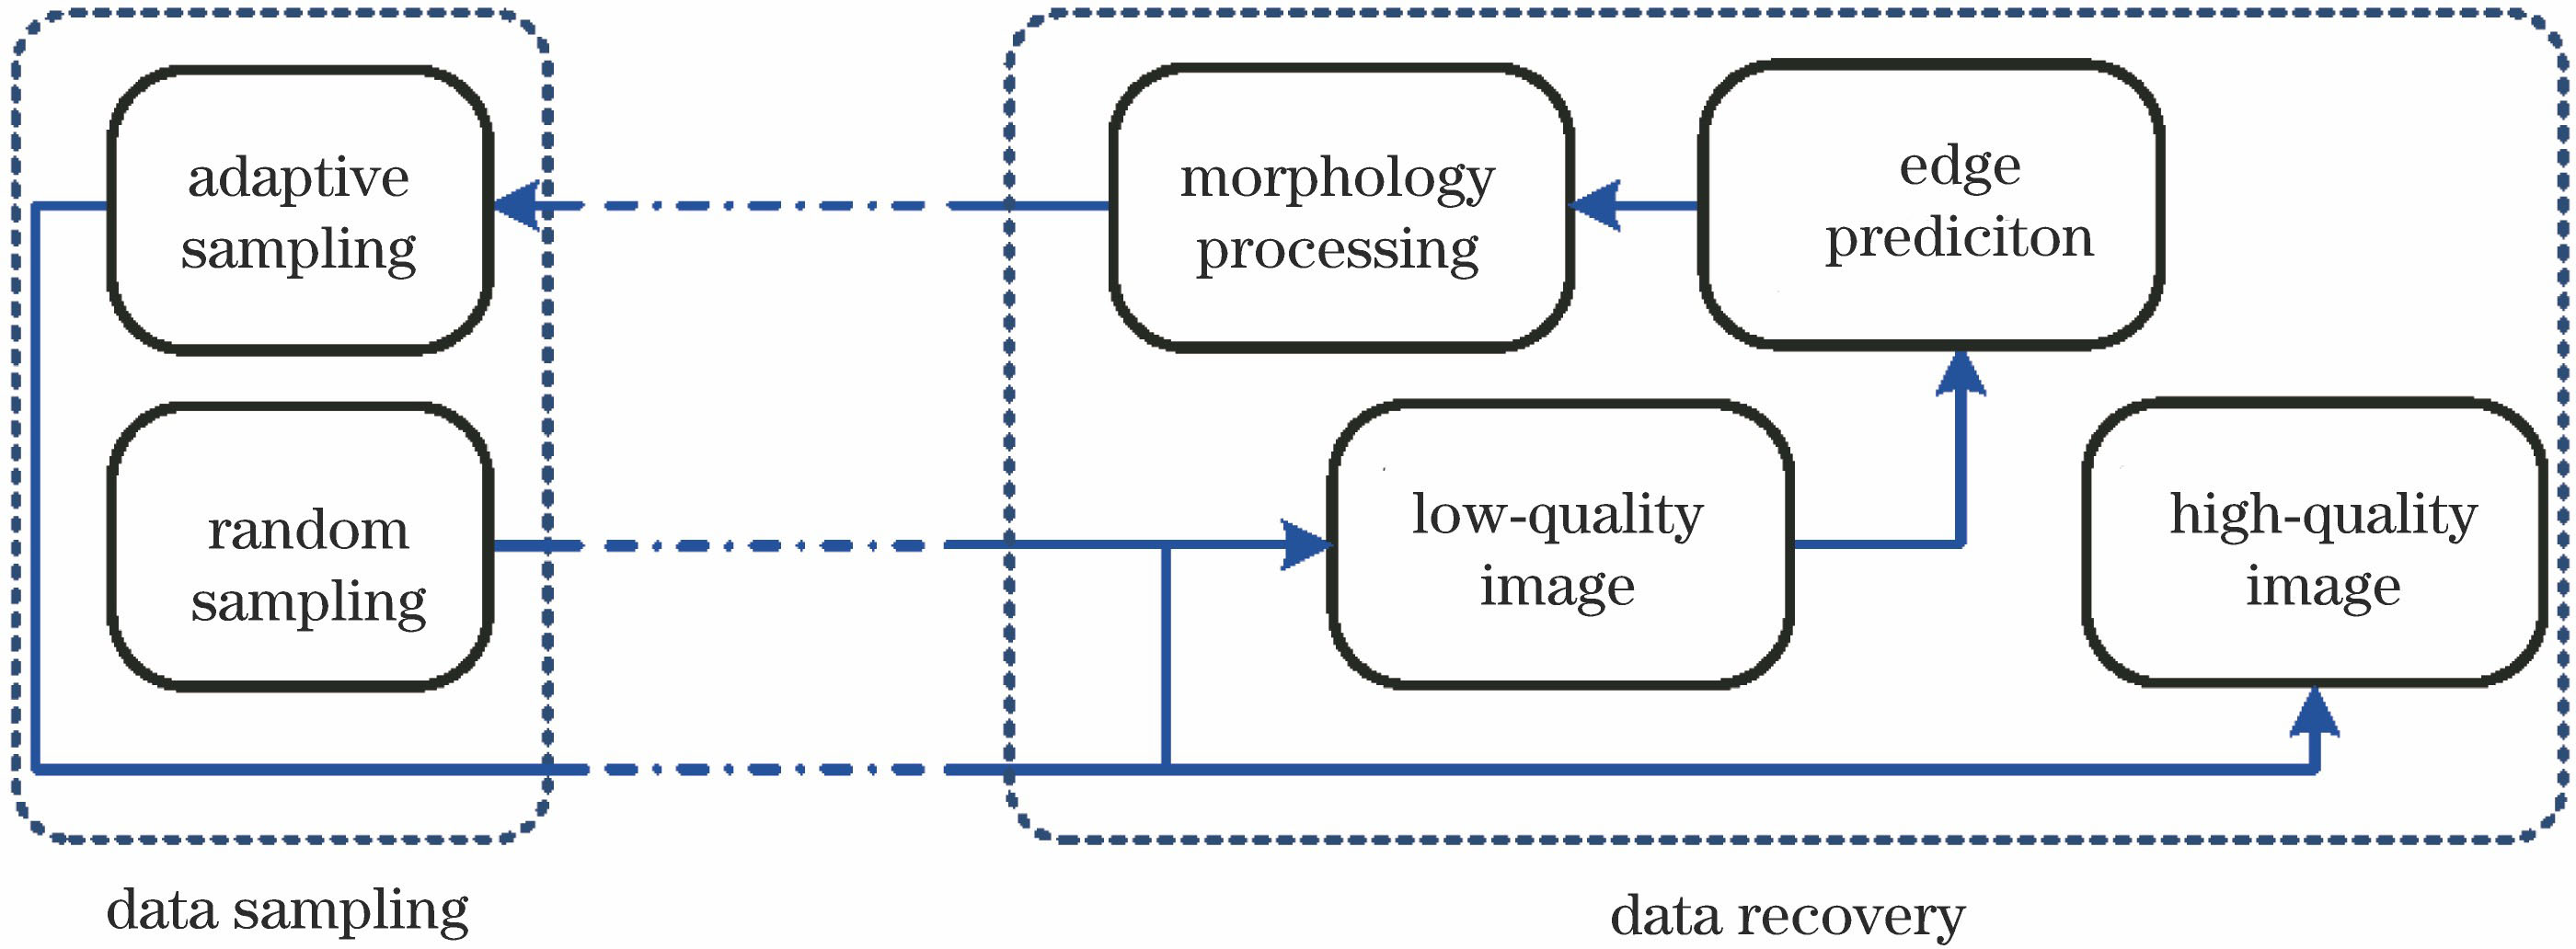
    Fig. 1. Schematic for the ASR framework
    Some test images. (a) Lena; (b) Fruits; (c) Boat; (d) House; (e) Cameraman; (f) Peppers
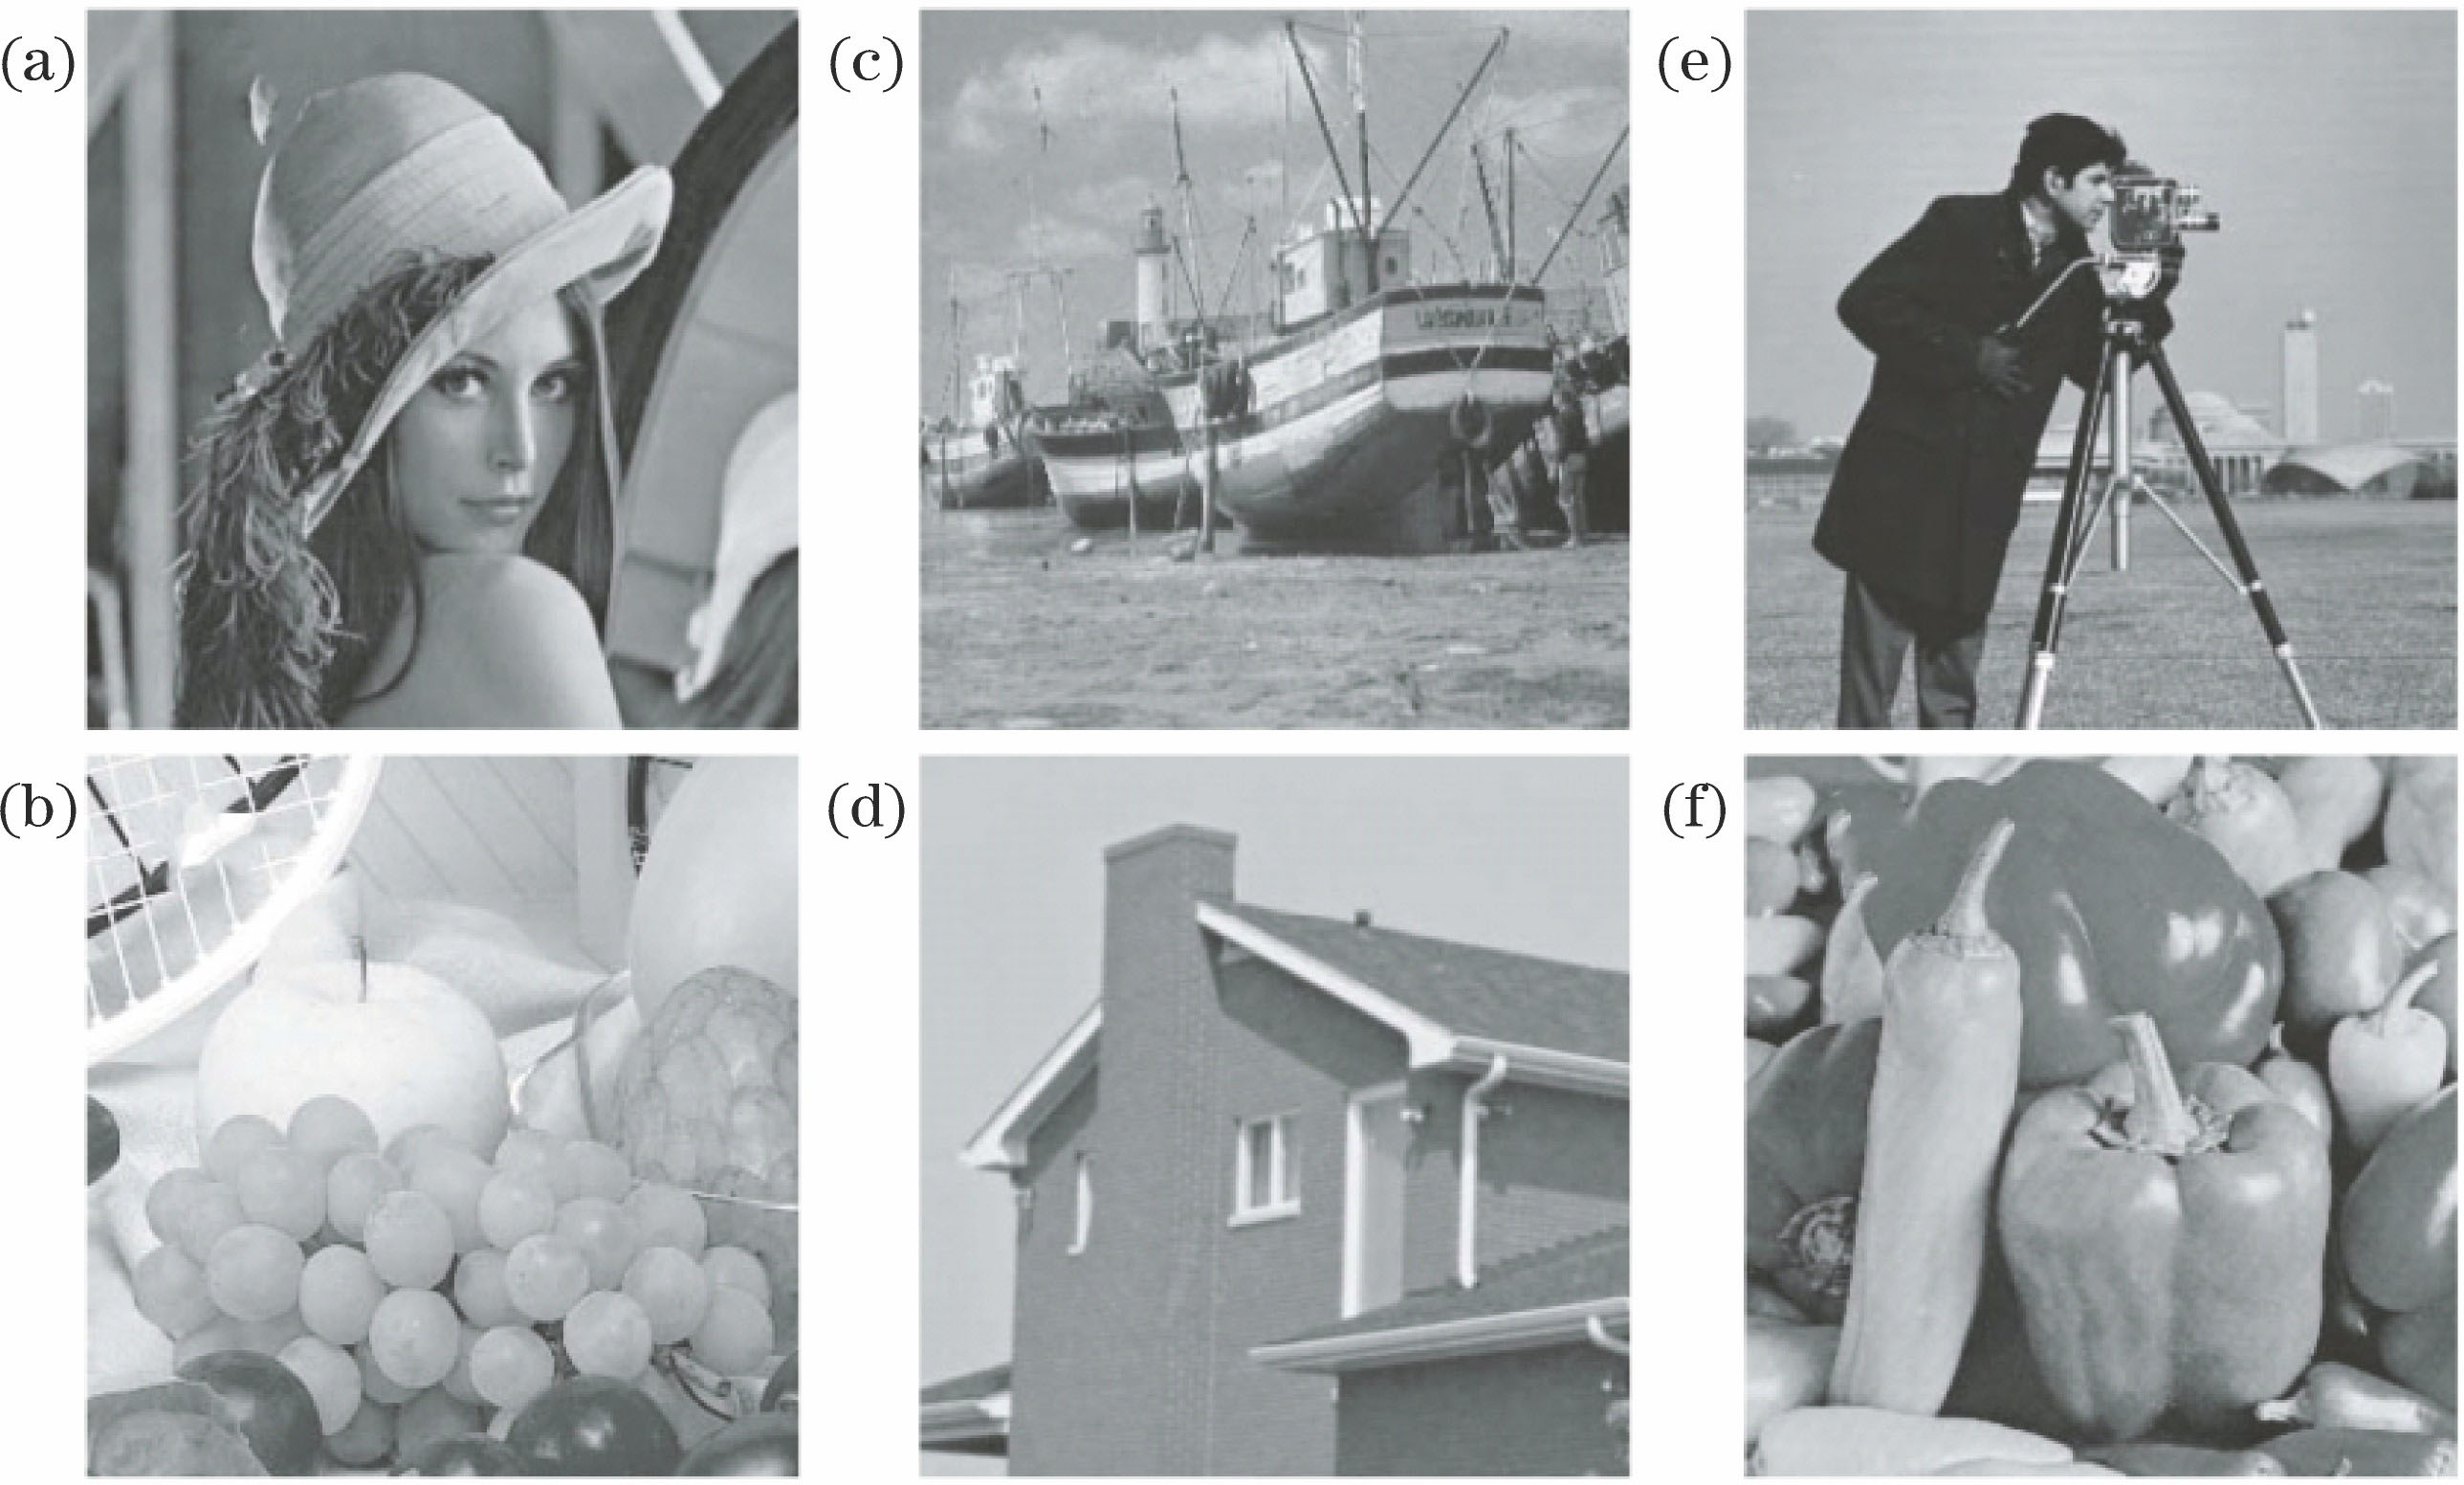
    Fig. 2. Some test images. (a) Lena; (b) Fruits; (c) Boat; (d) House; (e) Cameraman; (f) Peppers
    Comparison of effects of adaptive random sampling and completely random sampling
    Fig. 3. Comparison of effects of adaptive random sampling and completely random sampling
    Recovery effect of completely random sampling and different adaptive random sampling when sampling rate is 35%. (a) Original image; (b) Φr: 27.2 dB; (c) Φm+Mc: 31.3 dB; (d) Φm+Mcp</msubs
    Fig. 4. Recovery effect of completely random sampling and different adaptive random sampling when sampling rate is 35%. (a) Original image; (b) Φr: 27.2 dB; (c) Φm+Mc: 31.3 dB; (d) Φm+Mcp
    PSNR results of ASR and other CS recovery methods
    Fig. 5. PSNR results of ASR and other CS recovery methods
    Visual results of different algorithms with sampling ratio is 40%. (a)-(d) ASR; (e)-(h) BCS; (i)-(l) MARX; (m)-(p) TVAL3; (q)-(t) SRM
    Fig. 6. Visual results of different algorithms with sampling ratio is 40%. (a)-(d) ASR; (e)-(h) BCS; (i)-(l) MARX; (m)-(p) TVAL3; (q)-(t) SRM
    Optimal value estimation of adaptive sampling rate Φm+Md,cp
    Fig. 7. Optimal value estimation of adaptive sampling rate Φm+Md,cp
    ImageMARXASRTVAL3SRMBCS
    Lena5820.08.71.70.515.6
    Boat4620.56.81.80.614.3
    House5220.17.01.50.516.4
    Table 1. Running time of different algorithms for 256×256 image with sampling ratio is 35%s
    ImagePSNR /dB
    ASRBCSMARXTVAL3SRM
    Lena32.0631.0936.0829.5529.33
    House37.1934.6738.4628.0133.26
    Boat29.0426.6729.8727.5325.52
    Baboon21.4122.0322.0519.8020.59
    Table 2. PSNR values of different algorithms with sampling ratio is 40%
    Jun Yang, Bo Pan, Li Chen, Yongan Zhu, Tao Jiang, Chen Cui. Image Edge Information Aided Compressive Sampling Strategy[J]. Laser & Optoelectronics Progress, 2020, 57(8): 081018
    Download Citation