
V. D. Zvorykin, A. V. Shutov, N. N. Ustinovskii. Review of nonlinear effects under TW-power PS pulses amplification in GARPUN-MTW Ti:sapphire-KrF laser facility[J]. Matter and Radiation at Extremes, 2020, 5(4): 045401
- Matter and Radiation at Extremes
- Vol. 5, Issue 4, 045401 (2020)
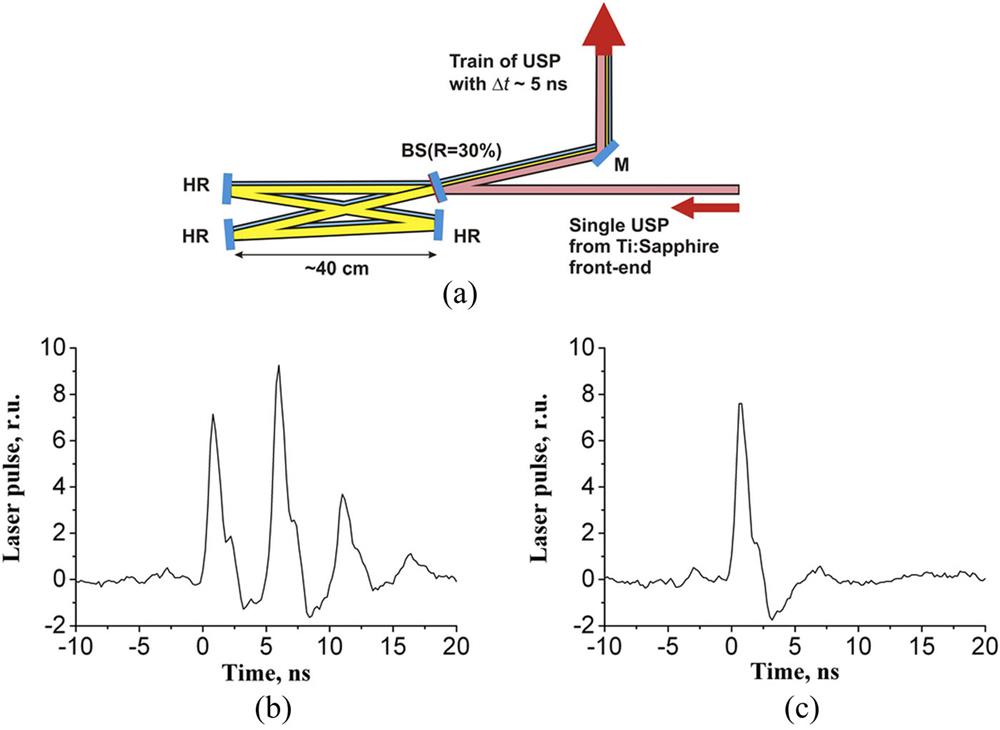
Fig. 1. (a) Pulse multiplexer, oscilloscope traces (b) of amplified USP train and (c) a single USP. The USP length is integrated by the PD.
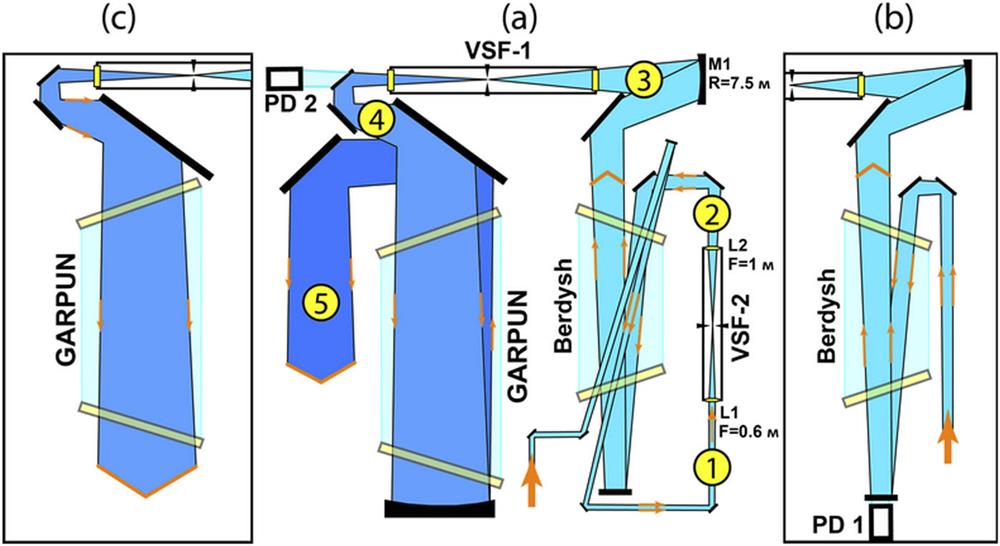
Fig. 2. Layouts of USP amplification in Berdysh preamplifier and GARPUN amplifier, with a different number of passes: (a) 4 + 2; (b) 2 + 2 with a double pass in the preamplifier shown only; (c) 4 + 1 with one pass in the amplifier shown only. The numbers 1…5 designate the positions of laser-beam distribution measurements in Fig. 5 .
Fig. 3. Energy of the USP train at the output of the amplifier chain in dependence on input energy in various amplification schemes.
Fig. 4. UV converter images at various distances from the final amplifier: (a) L < L f o n L > L f o n
Fig. 5. UV converter images in different positions 1–5 along the amplification pass in (4 + 2) layout [Fig. 2(a) ] for: (a)–(e) single USP and (f)–(j) USP train. Panel size is 3 × 3 cm2.
Fig. 6. UV converter images at various distances, L , from the final amplifier: (a)–(c) without and (d)–(f) with an Xe cell inserted 5 m beyond the amplifier. The round spot in the panel (d) is a near-field image of IR radiation. Panel size is 4 × 4 cm2. USP peak power in the units of P cr = 0.1 GW is shown in inserts. Intensities in images increase as the color sequence: purple, dark blue, blue, green, yellow, and red.
Fig. 7. USP spectra (a) L = 27 m beyond the final amplifier for energies 5 (1) and 100 mJ (2); (b) L = 95 m beyond the final amplifier for energies 2.5 (1), 8 (2), 30 (3), and 70 mJ (4). A shaded region corresponds to H2O absorption shown above the graphs.
Fig. 8. Layout of experiments on (a) filaments defocusing in Xe cell and (b) multiple filamentation suspension.
Fig. 9. The same fragment of the laser beam cross-section for the USP passed through a cell (a) filled with air, (b) evacuated to 10−5 atm, and (c) filled with Xe at 0.1 atm. (d) Corresponding intensity profiles in selected filaments highlighted by a white circle (1) in air, (2) vacuum, and (3) Xe. For clarity, the curves have been moved along the vertical axis. Intensities in images increase as the color sequence: purple, dark blue, blue, green, yellow, and red.
Fig. 10. UV converter images of the USP passing through an Xe cell and focused by an F = 2.5 m spherical mirror, with various attenuations of fluorescence: (a) a central part and (b) and (c) the periphery of the spot with oversaturated central part. Intensities in images increase as the color sequence: purple, dark blue, blue, green, yellow, and red.
Fig. 11. (a) Intensity distribution of radiation passed through the Xe cell in the focus of the F = 2.5 m mirror and (b) Gaussian approximation of angular distributions for the USP passed through Xe and air.
Fig. 12. (a) Layout of CaF2 transmittance measurements: 1–focusing and collecting lenses, 2–CaF2 sample, 3–iris aperture, 4–spectrometer: (I) transmitted radiation without the sample and (II) with the sample; (b) normalized spectra of 0.75 GW USP passed through (1) air and (2) CaF2 sample; line segment designates the KrF gain band of ∼2.5 nm; (c) experimental dependence of CaF2 transmittance on the incident USP intensity with approximation; filaments intensity range is shadowed.
Fig. 13. Side view of CaF2 fluorescence under the propagation of multiply filamented beam.

Set citation alerts for the article
Please enter your email address
© Copyright 2018-2021 | Chinese Laser Press. All Rights Reserved 沪ICP备15018463号-20