V. D. Zvorykin, A. V. Shutov, N. N. Ustinovskii. Review of nonlinear effects under TW-power PS pulses amplification in GARPUN-MTW Ti:sapphire-KrF laser facility[J]. Matter and Radiation at Extremes, 2020, 5(4): 045401
Copy Citation Text
Investigations were carried out at the multistage hybrid Ti:sapphire–KrF laser facility GARPUN-MTW on the direct amplification of TW-power picosecond UV laser pulses in e-beam-pumped KrF amplifiers and propagation along a 100 m laboratory air pass. The experiments identified the main nonlinear effects and their impact on the amplification efficiency, amplifier optics degradation, beam quality and focusability, and the evolution of radiation spectra. The research was performed towards an implementation of the shock-ignition concept of inertial-confinement fusion using krypton fluoride laser drivers.
I. INTRODUCTION
Among the various schemes of direct-drive inertial confinement fusion (ICF), the most efficient and feasible one for inertial-fusion-energy (IFE) production seems to be a shock-ignition (SI) approach.1,2 This constitutes the implosion of a spherical shell target, containing thermonuclear (TN) fuel, to a high areal density by the ablation pressure produced by the main driving pulse of TW power across the width of a few nanoseconds. This is followed by a final spike at one to two orders of magnitude of higher power with a width of several hundred picoseconds. A powerful spike pushes a strong convergent shock wave, which is synchronized with target collapse, and heats a small central region of the compressed target to the ignition temperature. After that, TN burning is maintained by emitted alpha-particles in the outer area. Laser-plasma instabilities (LPIs), developing in the underdense coronal plasma, restrict the upper intensity level in the main pulse, especially in the final spike.3,4 As the LPI thresholds decrease with radiation wavelength, UV lasers are the most attractive for the ICF. Among them, only frequency-tripled, diode-pumped, solid-state (DPSSL), and e-beam-pumped krypton fluoride (KrF) lasers are considered as promising drivers for IFE.5‒7
The short fundamental wavelength, λ = 248 nm, of the KrF laser favors high ablation pressure and higher LPI thresholds, while a broad radiation bandwidth, ∼3 THz, combined with the induced spatial incoherence (ISI) scheme allows very spatially and temporally uniform target irradiation with a focal spot moving along target imploding.8 As the KrF gain medium has a short collisional lifetime, τc ∼ 2 ns, with regard to the upper laser level, a stack of multiple nanosecond-scale pulses (required for ICF target implosion) is produced in the angular multiplexing scheme, each pulse propagating in the individual pass. The stack length is temporally matched with the e-beam pumping time of the amplifiers, which is typically a few hundred nanoseconds; it efficiently extracts the stored energy from the gain medium, after which, a demultiplexing scheme synchronizes all pulses on the target. While the abovementioned KrF laser benefits were realized in single shots at the 56-beam, 3-kJ Nike facility (US NRL), a reliable and efficient 5-Hz repetition-rate operation of Electra laser with up to 700 J output energy was demonstrated using a working gas recirculation cooling.8 As e-beam-pumped KrF amplifiers can be scaled up to the tens-of-kilojoules level9,10 the main requirements of an IFE driver, i.e., UV pulse energy ∼1 MJ, a 5–10 Hz operation, and an overall (“wall-plug”) efficiency ∼7% for a duty cycle of about 1 year,7,11‒14 could be fulfilled by a KrF driver.
Due to the heavy saturation of KrF amplifiers by high-power spikes, an SI pulse form is difficult to obtain in the quasisteady amplification of a pulse stack in an angular multiplexing scheme.15 An alternative way to obtain the SI pulse form is to combine short and long pulses immediately on a target; they can be simultaneously amplified in the same amplifier chains due to the short gain recovery time, τc ≈ 2 ns, of the KrF laser.16,17 Using this method, we have demonstrated the simultaneous amplification of a picosecond pulse train against a 100-ns lasing pulse at the multistage hybrid Ti:sapphire–KrF GARPUN-MTW laser facility.17 Taking into account that the short pulse amplification law is the same for any pulse length, τp ≤ τc ≈ 2 ns, it confirms the amenability of KrF laser pulse adjustment for the SI ICF via the simultaneous amplification of short and long pulses. Such an approach could tremendously simplify the architecture of the KrF-based IFE test facility.18
All large and moderate-size e-beam-pumped KrF laser installations, such as Nike,8 Aurora,19 Super-Sprite (and its predecessor Sprite),20 Super-ASHURA (ASHURA),21 and Heaven-I,22 utilize multiplexing/demultiplexing pulse-delay lines of hundreds of meters in length located in atmospheric air, although laboratory air has been cleaned and temperature stabilized. At the high peak power (P ≥ 1 GW) transferred in nanosecond pulses along these lines, which is significantly higher than the critical power for radiation self-focusing at 248-nm wavelength (Pcr ∼ 0.1 GW in atmospheric air, three orders of magnitude lower in laser windows), no evidence of nonlinear beam distortion was reported. The ISI implemented in some of these facilities can prevent the onset of self-focusing. At the same time, a spectral broadening has been observed for 5 GW sub-ns pulses due to stimulated rotational Raman scattering (SRRS) in atmospheric nitrogen.23
The danger of nonlinear processes, which can produce extra losses during pulse amplification and laser-beam distortion under propagation in a long air pass, significantly increases for the direct amplification of TW-level picosecond pulses.24 A multiple filamentation of 10 cm in diameter, 400 GW (250 mJ and 0.6 ps) beam was first observed at 3–4 m distance from a discharge-pumped KrF amplifier; it was eliminated by passing the beam through helium, which has a low nonlinear refractive index n2.25 Unfortunately, there is a lack of information about beam-quality degradation in experiments26‒28 on the amplification of picosecond pulses, up to the highest powers of ∼10 TW, performed at e-beam-pumped KrF facilities with a 60-cm aperture of the final amplifier, which are relevant to fast ignition or SI ICF studies.
A multiple filamentation of laser radiation has been observed since the first experiments at GARPUN-MTW laser,29‒31 with a TW-level in picosecond pulses. Filaments introduced nonlinear energy losses in both gain-medium and amplifier optical windows, resulting in a low-level saturation of short-pulse energy, as well as damage to laser optics. To obviate filamentation, a chirped-pulse amplification (CPA) scheme32 can be used instead of direct amplification, to obtain ultrashort pulses (USPs) at extremely high peak-powers in solid-state amplifiers.33 The CPA for KrF lasers has also been demonstrated,34,35 but it is unlikely to be implemented in an MJ-class facility with angular-multiplexed, large-aperture multiple beams; this is because of considerable difficulties in manufacturing and the great cost inherent to large-scale diffracting gratings for USP compression. Alternatively, we explore a large, negative, two-photon, resonantly-enhanced, nonlinear refractive index in Xe,36 which could compensate for a nonlinear phase shift acquired along the propagation pass in air and in the amplifier windows. In this review paper we summarize our four-year activity in this field.
II. DIRECT AMPLIFICATION OF TW-POWER PICOSECOND PULSES
A. Ti:sapphire–KrF GARPUN-MTW laser facility
Experiments were performed at the hybrid GARPUN-MTW laser facility,16 which comprises a Ti:sapphire front-end; two e-beam-pumped KrF amplifier stages, i.e., Berdysh preamplifier 10 × 8 × 110 cm3 gain medium and a final, large-aperture 16 × 18 × 100 cm3 GARPUN amplifier; as well as a discharge-pumped KrF laser. The final amplifier is transversely pumped by two counter propagating e-beams with a pulse length of ∼100 ns, an electron energy of 350 keV, and a current density of 50 A/cm2. In free-running operation with a specific pumping power, Wb = 0.7–0.8 MW/cm3, of a working gas mixture Ar/Kr/F2 at a pressure of 1.4 atm, the laser produces energy of up to 100 J. The Berdysh preamplifier is transversely pumped by a one-sided e-beam with similar parameters, Wb = 0.6–0.7 MW/cm3; a working gas pressure of 1.8 atm generates about 25 J. A frequency-tripled Ti:sapphire front-end Start-248M (Avesta Project Ltd.) generates USPs of ∼ 100 fs temporal length, ∼ 0.8 nm spectral width (FWHM), a near-Gaussian special profile in the beam diameter of ∼8 mm, and up to 0.5 mJ of energy at a wavelength tuned to the maximum of the KrF (B → X) gain band, around λ = 248 nm. For synchronization of the front-end and e-beam-pumped amplifiers, 200-mJ, 20-ns pulses of a discharge-pumped KrF laser (Lambda Physik EMG Model TMSC 150) fire spark gaps of five water-filled Blumlein pulse-forming lines, which supply HV pulses to vacuum diodes, generating e-beams.
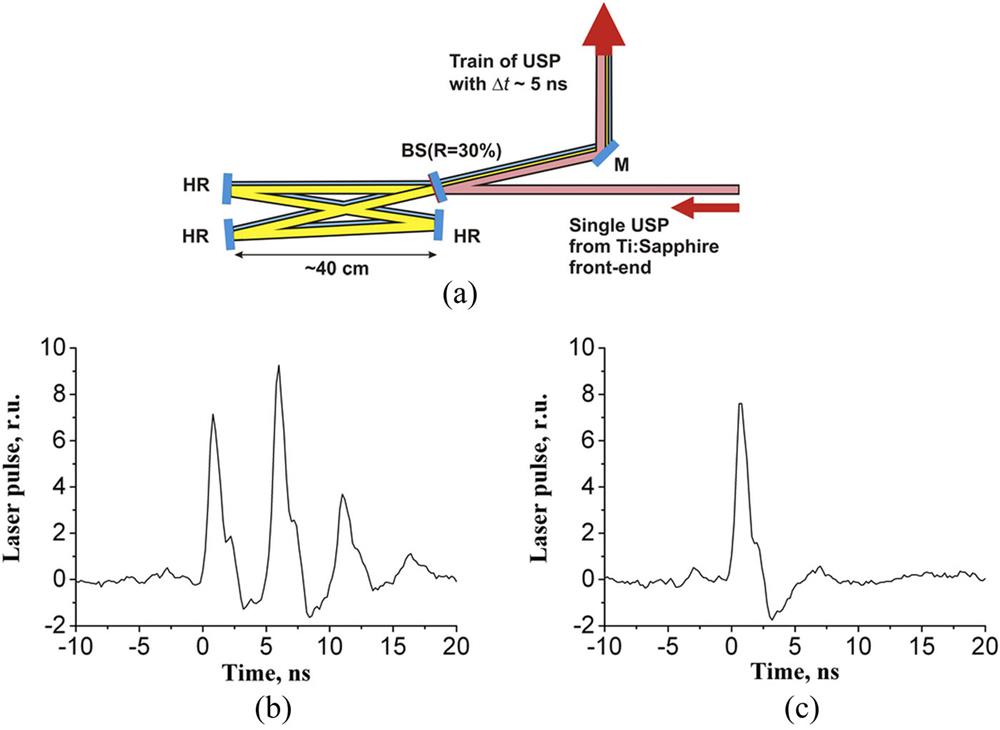
To align an optical scheme, the front-end operates with a 10-Hz repetition rate. In the case of USP amplification, electromechanical shutter cuts a single USP from a continuous sequence. To obtain a short train, a single USP is introduced into a ring multiplexer [Fig. 1(a)], being formed by three flat, highly reflective (HR) mirrors and a beam splitter (BS) with 30% reflection (a thin CaF2 plate with a dielectric coating). The total train energy E ∼ 0.1 mJ was distributed between individual USPs in the train in the proportion E1: E2: E3: E4 … = 3: 5: 1.5: 0.5…. Aligned mirrors provided coincidence of USP directions in the train, while their temporal spacing (defined by the multiplexer round-trip delay time) Δt ∼ 5 ns was chosen to be slightly more than the gain-recovery time in the KrF gain medium of τc ∼ 2 ns.16,17 Vacuum photodiodes (PDs) with a temporal resolution ∼1 ns were used, whose signals were recorded on a four-channel Tektronix TDS-3054 digital oscilloscope with a sampling rate of 5 GHz. Although PDs integrate individual USPs, they can resolve USP time separation in a train and measure the energy distribution between USPs [Fig. 1(b)]. With the delay line shuttered, there was only the first USP of a train at the multiplexer output, which contained about 30% of the total train energy [Fig. 1(c)]. Output radiation was telescoped with three-fold magnification to reduce nonlinear distortions along the aerial pass of ∼15-m length to the preamplifier chain.
Figure 1.(a) Pulse multiplexer, oscilloscope traces (b) of amplified USP train and (c) a single USP. The USP length is integrated by the PD.
Various multipass amplification schemes were investigated37 to obtain the highest energy in the USP train with minimal amplified spontaneous emission (ASE): (i) a successive double-pass amplification in the Berdysh preamplifier and GARPUN amplifier, designated as a (2 + 2) scheme; (ii) a four-pass amplification in the preamplifier followed by one-pass—a (4 + 1) scheme; or (iii) a double-pass amplification (4 + 2) in the final amplifier. The layouts of these experiments are shown in Fig. 2. To reduce exponential growth of the ASE with amplification length, vacuum spatial filters are set between the preamplifier and amplifier stages (VSF-1), and after the first two passes in the preamplifier (VSF-2) when it is used in the four-pass scheme. VSF-1 has a length of 6 m with a pinhole at half-length; its windows are 1-cm thick CaF2 uncoated plane plates, slightly tilted off the beam axes. VSF-2 possesses two thin CaF2 lenses with F1 = 0.6 and F2 = 1 m; its shoulders are chosen to expand a collimated beam of ∼30 mm in diameter when it is in the first two passes in the preamplifier, and to fill the whole aperture in the subsequent two passes.
Figure 2.Layouts of USP amplification in Berdysh preamplifier and GARPUN amplifier, with a different number of passes: (a) 4 + 2; (b) 2 + 2 with a double pass in the preamplifier shown only; (c) 4 + 1 with one pass in the amplifier shown only. The numbers 1…5 designate the positions of laser-beam distribution measurements in Fig. 5.
The energy of a USP train, Ein, fed to the amplifiers chain was varied step-by-step from 0.08 μJ to 80 µJ by a diffraction attenuator. Amplified energies, Eout, were measured for preamplifier by a calorimeter set behind VSF-1; for the main amplifier calorimeter was set 10 m away from its output. Simultaneously, with amplified USPs, calorimeters measured a small part of the ASE energy falling into its aperture angle, which was significantly less than the ASE angular width.16 The ASE contribution was measured in mimic laser shots when input USPs were shut down; these values were then subtracted from the calorimeter readings in full-blown shots. A pinhole in VSF-1 was optimized to transmit all USP energy from the preamplifier, and at the same time to block most of the ASE. Nevertheless, some ASE from the Berdysh preamplifier passed through the pinhole and was amplified in the main amplifier, on a par with USPs. In the (2 + 2) scheme, the ASE contribution to USP output energy was ∼2%. In the (4 + 1) scheme and especially in the (4 + 2) scheme, the ASE fraction increased significantly up to ∼10% and ∼50%, respectively.
Photodiodes set behind the turning mirrors (their small transmittance provided necessary attenuation) were used to monitor the ASE pulse of 100-ns length (equal to the pumping time) and the USP amplification dynamics. The ASE amplitude, representing a gain in amplifiers during a quasisteady central part of the pulse, was depleted during USP passage; it was restored to its initial level after τc ∼ 2 ns. Therefore, for a given USP separation, Δt ∼ 5 ns, a steady train amplification took place. A little energy redistribution between individual USPs in the train was caused by a slight temporal mismatch of gain profiles in amplifiers with the train. A single USP (with a blocked delay line in the multiplexer) was amplified in the same manner, while its energy was on average a factor of 2.5 lower than the whole train energy.
Figure 3 shows the dependences Eout (Ein) measured in various amplification schemes. A saturation of output energy with increasing input energy is explained by saturation of a gain coefficient, while there is significant nonsaturable absorption in the gain medium.16
Figure 3.Energy of the USP train at the output of the amplifier chain in dependence on input energy in various amplification schemes.
The amplification dynamics for short pulses of τp ≤ τc ≈ 2 ns, propagating in the amplifier chain in the presence of absorption, is described by a modified Frantz–Nodvick equation:37where ϕ = ε/εs, is energy density, and I(x,t) is intensity of USP; εs ≈ 2 mJ cm−2 is the saturation energy density; g(x) is the gain distribution formed due to saturation of the initial, small-signal gain coefficient, g0, by the ASE prior to the USP entering the amplifiers; and αns is a nonsaturable absorption coefficient. Coefficients g0 and αns are defined by a specific pumping rate of the gain medium, while the ratio g0/αns = 10–20 weakly depends on pumping.16 In ideal case, g(x) ≡ g0; i.e., without any gain depletion via ASE, optimal energy density for obtaining maximal extraction efficiency from the gain medium is εopt = εs ln(g0/αns) = 4.6–6.0 mJ cm−2, while maximal energy density, which can be achieved in heavy saturation (dϕ/dx = 0), is εmax = εs(g0/αns) = 20–40 mJ cm−2. In the limit of low energy density (ε ≪ εs), the exponential growth of output energy with amplifier length εout = εin exp[(g0−αns)l] follows from Eq. (1).
Numerical simulations16 show that in a double-pass GARPUN amplifier the ASE reduces the initial gain coefficient g0 = 0.08 cm−1 on average by a factor of 2 to ≈ 0.04 cm−1, even if there is no ASE seeded from the Berdysh preamplifier. In addition to nonsaturable absorption with coefficient αns ≈ 6 × 10⁻³ cm−1, energy losses are introduced by Fresnel reflection of uncoated CaF2 amplifier windows and by mirrors of the optical tract. In total, this gives an effective loss coefficient αΣns ≈ 0.01 cm−1. That is, an average net gain is expected to be about ≈ 0.03 cm−1. The value gnet = 0.033 cm−1 was found in the (2 + 2) scheme for a gain ratio G = Eout/Ein = 5 × 10⁵ of output energy Eout = 0.04 J to the lowest input energy Ein = 0.08 µJ. For the same input energy in the (4 + 1) and (4 + 2) schemes Eout increased with amplification length up to 0.2 J and 0.7 J, respectively, while the average gain decreased to gnet = 0.029 cm−1 and 0.026 cm−1, respectively. Maximal output energy density calculated for a single pulse (with a blocked delay line in the multiplexer), over a ∼200 cm2 (for an aperture filling factor ∼0.7) beam area in this case was εout =1.4 mJ cm−2 < εs; that is the amplifier chain was not in saturation. Therefore, a decrease in gain coefficient, gnet, with amplification length was caused not so much by USP saturation in the amplifier chain, but by a depletion of the gain medium by ASE.
The maximum train energy Eout ≈1.2 J in the (2 + 2) amplification scheme was slightly less than in the (4 + 2) case, with Eout ≈ 1.6 J, but it had a significantly less ASE contribution; the (2 + 2) scheme appeared to be more reliable in respect of amplifier window degradation (see Sec. III C). For single-pulse energies 0.5 J and 0.65 J, the corresponding values of energy density, εout = 2.4 mJ cm−2 and 3.2 mJ cm−2, lay far from the heavy-saturation regime; this means that with increasing USP energy (power), nonlinear losses began to dominate, and they significantly reduced the attained energy.
The USP length at the output of the (2 + 2) amplification scheme was measured by two single-shot autocorrelators using counterpropagating beams based on either two-photon fluorescence of a BaF2 crystal or an XeF gas mixture; they gave similar results with USP length τp ≈ 1 ps (FWHM), which was stretched from the initial 100 fs due to a group velocity dispersion in the amplifier windows and air propagation pass. Thus, a USP peak power ∼0.65 TW was achieved.
III. MULTIPLE FILAMENTATION OF TW-POWER PICOSECOND PULSES
A. Origin of multiple filamentation
Self-focusing of powerful laser radiation originates from a positive, intensity-dependent, Kerr nonlinear additive to the refractive index caused by polarization of the medium in the intense laser field. The self-focusing onset occurs at critical power Pcr = 3,77λ2/8πn0n2 (n0 and n2 are the linear and nonlinear refraction indices, respectively), which is tantamount to equality between self-focusing and diffraction. As both effects depend on beam diameter in the same manner, any defocusing mechanism is required to arrest beam collapse, e.g., a negative additive to the refractive index of electrons produced by laser field ionization of matter. The most common mechanism of a long filament-like channel formation in air for USP pulses in the visible and near-IR spectral range is a dynamic balance of Kerr self-focusing and plasma defocusing n2If ≈ ρef(I)/2ρc, where If = 1013–1014 W cm−2 is the typical peak intensity in filaments (this depends on whether the laser beam is prefocused or not), ρef = 1015–1016 cm−3 is an electron density produced by the multiphoton ionization (MPI) of a gas, ρc = ε0meω2/e2 is the critical plasma density, ε0 is the permittivity of the vacuum, ω is the laser frequency, and me and e are the electron mass and charge.38 For UV radiation from a KrF laser n0 ≈ 1, n2 ≈ 10−18 cm2 W−1, and thus, the critical power for self-focusing in atmospheric air is rather low (Pcr ≈ 0.1 GW). For very high “supercritical” USP peak power P ≫ Pcr, which is attained at the GARPUN-MTW facility self-focusing of the initial intensity irregularities broke up a laser beam into multiple filaments, which were observed in a course of USP amplification and subsequent propagation along a 100-m air pass.29‒31
To visualize UV laser radiation, nonlinear fluorescence of K8 glass (similar to BK7) in the visible region of the spectrum was used, which was measured by a Spiricon SP620U Beam Profiler (Ophir Photonics) (see Fig. 8 below). As the penetration depth of KrF laser light in this glass was measured to be rather high ∼30 µm, the ablation threshold for picoseconds USP was, at least by an order of magnitude, higher than that found for filaments. Glass fluorescence, f, was calibrated by its dependence on the USP energy density, ε, at the Ti:sapphire front-end. The obtained dependence, f ∝ ε0.4, in a large dynamic range ∼104, allowed us to register both filaments and background radiation in a single shot without saturation and damage to the profiler.39
In the optimum (2 + 2) amplification scheme, the phase modulation of USP radiation transmitted through the CaF2 block windows of the GARPUN amplifier produced a moiré-like beam pattern at the amplifier output with intensity variations of a few percent. While the perturbation amplitude increased with increasing distance and USP power, a stochastic diffraction structure with random cellular fringes was formed [Fig. 4(a)]. At even larger distances (or higher powers) multiple filaments arose [Fig. 4(b)], being distributed exactly along the cellular fringes. At USP peak power, P ≈ 0.2 TW, fully formed multiple filaments appeared at ≈ 15 m distance from the output of the final amplifier.
Figure 4.UV converter images at various distances from the final amplifier: (a) L < and (b) L > .
About 300 randomly distributed filaments were counted over the beam cross-section ∼60 mm in size at L ≈ 30 m beyond the final amplifier. Filaments contained 0.3 of the total USP energy ≈0.2 J, while the rest formed the background radiation.31 The average energy in each filament was Ef ∼ 0.2 mJ, corresponding to peak power Pf ∼ 0.2 GW, which was a doubled Pcr. The typical diameter of filaments was in the range df = 240–340 µm (FWHM), which, assuming a Gaussian distribution in the filaments, gave a peak intensity If = (2.0 ± 0.6) × 1011 W cm−2 and energy density εf = 0.2 ± 0.06 J cm−2. The filament electron density, ρef ≈ 1013 cm−3, was calculated for typical laboratory air conditions: temperature T = 20 °C and relative humidity 50% which gives a water-vapor concentration NH2O = 2.9 × 1017 cm−3. Although water content in atmospheric air usually does not exceed 1%–2%, the MPI of water vapor was shown to dominate in air ionization by KrF laser radiation in the spectral range of 248–249 nm, which covers two-photon resonance with the H2O molecule electronic transition . An abnormally high ionization cross-section, σ(3) = (5.6 ± 3.8) × 10−27 cm6 s−1 W−3, two to three orders of magnitude larger than that of O2 or N2, was measured for such a (2 + 1) resonance-enhanced multiphoton ionization (REMPI) mechanism.40,41
For measured filament parameters, Kerr self-focusing is much stronger than plasma and diffraction defocusing, . Therefore, for a large-area, slightly-focused or collimated UV beam a plasma-free model should be sought instead of a conventional plasma-driven filamentation model.38 Our experiments revealed two important features: (i) the dominant role of REMPI processes compared with a direct MPI by IR light; and (ii) the rotational orientation of anisotropic oxygen and nitrogen molecules, i.e., stimulated rotational Raman scattering (SRRS) in the laser field of ps-length USP.31 Both processes change matter polarization, thus contributing to the nonlinear refractive index, in addition to the instantaneous bound-electron response in molecules. Coherent SRRS arises when the pulse length (∼1 ps) is shorter than the characteristic relaxation time of polarization (≥100 ps)42 and the pulse spectrum is wider than the eigen frequency of the equivalent two-level model oscillator (i.e., the Stokes shift). We believe that the SRRS process dominates in UV radiation self-focusing in our case with transitions between J = 6 and J = 8 nitrogen rotational states, which is characterized by a Stokes shift of 75 cm−1, while the USP spectral width is ∼200 cm−1. The plasma-free filamentation under coherent SRRS was obtained theoretically by solving the USP envelope equation;31 this gave a threshold of self-focusing close to the commonly accepted Pcr = 0.1 GW and a perfect fit with the measured values of the energy per filament of 0.2 mJ and the filament diameter of 300 µm.
A higher-order Kerr effect (HOKE) can also saturate intensity in filaments instead of plasma balancing.43‒45 A plasma-free filamentation was recently observed for a tunable UV USP around 300 nm wavelength. It was demonstrated that for (3 + 1) REMPI of high-pressure Kr near resonance, HOKE dominated plasma defocusing.46
B. Beam filamentation in the four-pass Berdysh preamplifier
We had several questions during this investigation: (i) Do perfect monocrystal CaF2 preamplifier windows, being free of phase aberrations, obstruct the formation of filaments? (ii) Do these windows survive in the filamented beam? (iii) Is there any effect from spatial filters on beam filamentation? (iv) How does filamentation progress for a single USP and a USP train? (v) What does the USP intensity distribution look like in the GARPUN amplifier after four-pass amplification in the Berdysh? The areal distribution of USP radiation (glass converter fluorescence) was recorded along the amplification pass in several positions numbered in Fig. 2(a). They are presented in Fig. 5 for both the single USP and the USP train.
Figure 5.UV converter images in different positions 1–5 along the amplification pass in (4 + 2) layout [Fig. 2(a)] for: (a)–(e) single USP and (f)–(j) USP train. Panel size is 3 × 3 cm2.
It was expected that a near-Gaussian laser beam produced by a Ti:sapphire front-end would not be distorted in monocrystal CaF2 windows. However, the intensity distribution in position 1 became modulated after the first two passes through preamplifier [Figs. 5(a) and 5(f)]. Apparently, laser-beam diffraction along the 20-m air pass from the front-end to the preamplifier, and passage through windows of 8 cm total thickness (for two passes), caused this spatial self-modulation of radiation whose power, P ≥ 20 GW, significantly exceeded Pcr. Note, that even without preamplifier pumping for USP energy ≤0.1 J and an estimated peak power of a few Pcr, a heterogeneous distribution was seen in this position.30 Spatial filter VSF-2 did not equalize this intensity modulation in position 2 [Figs. 5(b) and 5(g)] and it served as a forerunner of multiple filamentation, evident in Figs. 5(c) and 5(h) after two successive passes through the preamplifier in position 3. Note that because of expanding laser-beam geometry we registered here and downstream only a part of the beam cross-section. After four passes, USP energy increased to ∼0.1 J, and its peak power grew up to a supercritical level P ∼ 0.1 TW. The large intense spot at the bottom-left side of the image panels is the ASE formed in the last two passes of the gain medium; it was hampered by spatial filter SF-1 in position 4, while filaments in the USP intensity distribution were redistributed [Figs. 5(d) and 5(i)]. Some of them formed filament clusters of a greater size. Measurements in the final position 5 were done after a double-pass through the main unpumped amplifier [Figs. 5(e) and 5(j)]. Multiple filaments still exist, although for larger cross-sections of the beam their areal density decreases, while filament diameter seems to increase. The USP propagation length from the front-end in this case amounted to ∼45 m, and the total CaF2 thickness of windows for VSF-1, preamplifier, and amplifier was 30 cm.
Comparison of filament patterns formed by a single USP [Figs. 5(a)–5(e)] and by the USP train [Figs. 5(f)–5(j)] shows their similarity; that is, the position of individual filaments and their areal distribution does not change significantly with respect to the USP duty cycle in the train. In addition, filamentation patterns demonstrate a long-term shot-to-shot reproducibility when subsequent USPs are repeated within several minutes.
C. Effects of beam filamentation on saturation of KrF gain medium and degradation of amplifier windows
Multiple filaments arising in a supercritical USP laser beam concentrate an extra-high peak intensity, If ∼ 2 × 10¹¹ W cm−2, and energy density, εf ∼ 0.2 J cm−2, which are 100 times larger than those values averaged over the laser-beam cross-section (∼200 cm2) in the final amplifier. Thus, the energy density in filaments is two orders of magnitude higher than the saturation energy density, εs = 2 mJ/cm2, of the KrF gain medium, which is a key parameter for USP amplification; moreover, it exceeds by several times the maximum energy density, εmax = 20–40 mJ/cm2, achieved in a heavily saturated regime (see above Sec. II B). This means that the KrF gain medium would absorb filaments coming to the input of GARPUN amplifier, as was indeed the case in the (4 + 1) and (4 + 2) USP amplification schemes. Although background radiation containing ∼70% of the total USP energy would still be amplified, absorption in filaments would reduce the attained USP energy.
High intensity in filaments also provokes three-photon absorption, nonlinear scattering of laser radiation, and spectral broadening of the filamented laser beam in amplifier windows. This will be discussed further in Sec. V. Together with the absorption of filaments in the gain medium, intensity-dependent nonlinear losses explain a premature energy saturation in (4 + 1) and (4 + 2) amplification schemes. Indeed, in a direct measurement with a USP train of ∼1 J of energy passed through a 30-mm thick, uncoated CaF2 plate (the same type as the amplifier windows), the transmittance was measured to be 50–60% (with a contribution from Fresnel reflection of ∼8% by both plate sides).
Intensity-dependent nonlinear losses were probably the reason for our unsuccessful attempt to increase the USP peak power by reducing pulse length. A negatively chirped pulse formed by a two-prism stretcher was injected into a (2 + 2) amplification chain in order to compensate for a positive USP dispersion in air and the amplifier windows. As output USP was shortened to 150 fs, its energy fell proportionally, and output USP peak power stayed approximately the same.
When filaments were fully formed in a course of four-pass USP train amplification in the Berdysh preamplifier, volumetric damage of the output window was observed in the form of multiple filament-like tracks. In addition, high-intensity filaments produced color centers responsible for transmittance degradation, similar to that found in X-ray or electron-beam irradiation.47,48 After several hundred shots, transmittance of the output window of the GARPUN amplifier decreased from an initial value of ∼92% (including Fresnel reflection) to 72%, while the transmittance of the opposite window, which operated at a lower USP power, decreased to 84%.
We found three different ways to restore CaF2 window transmittance: (i) 6 h annealing in a muffle furnace at a temperature of 350 °C and subsequent polishing to remove the defect layer formed in saturation of heated CaF2 with atmospheric gases; (ii) color-center bleaching by continuous (for 18 h) UV/visible irradiation from a mercury lamp PRK-2, which produces line emission, with the most intense lines at 248.2, 253.7, 265.2, …, 302.2/2.6, 312.6/3.2, and 365.0/6.2 nm; (iii) color center bleaching by pulsed nanosecond KrF laser irradiation.49 The last two methods are preferable, as they allow windows to be treated without disassembling them and submitting them to posttreatment polishing.
D. USP attenuation, filamentation range and spectra evolution along 100 m air pass
In the literature there is a large spread of data on the range of filaments in atmospheric air, which is mostly recorded with a Ti:sapphire laser at an IR radiation wavelength of around 800 nm. These experiments aimed to produce long ionized channels for different applications, such as triggering atmospheric discharges and the remote sensing of atmospheric pollution. As critical power for self-focusing in the IR is 30 times higher than for the UV radiation of a KrF laser, a high multiTW peak power is required to obtain multiple filamentation in a collimated IR beam. In most of these experiments, a negative frequency prechirp was introduced into the initial USP by stretching it up to 10 ps; this allowed compensation for the positive chirp acquired due to group-velocity dispersion during prolonged air propagation. The plasma-filament range with electron density ρef = 1015–1016 cm−3 measured with powerful Ti:sapphire facilities was a few hundred meters,50 although the longest ever reported achieved 2 km.51,52 Energy attenuation caused by air ionization and atmospheric turbulence was shown to restrict the plasma-filament range, while plasma-free, pure-light filaments with ρef ∼ 1012 cm−3 were observed at longer distances.51,53
In the UV spectral range, there have been several early experiments performed with a KrF laser. For a 1-ps USP with a peak power of ∼25 GW, about ten filaments with a diameter of ∼100 µm, intensity If ∼ 1012 W cm−2, and electron density ρef = 3 × 1015 cm−3 were observed in a collimated beam of 10 mm diameter over a 12-m distance.54,55 For an externally focused USP of 4 GW/450 fs, several filaments merged into a single filament of 150 µm diameter with If = 2 × 10¹¹ W/cm2 and ρef ∼ 1015 cm−3.56,57
Our goal was the investigation of sub-TW power USP attenuation and spectral evolution in a long-distance propagation compared with a typical angular multiplexer beamline length. In contrast with what is discussed above concerning multiTW Ti:sapphire lasers, from the very beginning of filamentation at ≈ 15 m, from the final amplifier, filaments exist with weak air ionization ρef ≈ 1013 cm−3 (Sec. III A). We measured intensity distributions and USP spectra in a nearly collimated UV laser beam of 6 cm diameter, which was formed in a (2 + 2) amplification scheme by the concave rear mirror (with radius of curvature of R = 20.3 m) of a GARPUN amplifier (Fig. 2) and a convex (R = −39.3 m) mirror set at ∼10 m distance from the amplifier output. Cross-section beam patterns, USP energy, and radiation spectra were monitored along the 100-m air pass in a laboratory corridor.
Beam patterns shown in the upper panels of Figs. 6(a)‒6(c) were measured by the UV converter described above in Sec. III A. The converter was moved along the corridor pass, while the initial USP energy (a single pulse) was kept approximately constant, E0 ≈ 0.2 J. The corresponding peak power is shown in the upper-left corners of the panels, accounting for USP energy attenuation with distance L. Energy attenuation was measured with a calorimeter moved along the pass and could be approximated by an exponential law with a characteristic e-fold attenuation length, le ≈ 150 m. A gradual reduction in filament areal density and intensity relative to background radiation is observed with distance. At the maximum length L = 95 m filaments are hardly seen. Filament degradation was not caused by air turbulence.58 Additionally, a USP energy attenuation of 35% at the corridor end could not stop filamentation, as the USP peak power P was still supercritical (P ≫ Pcr).
Figure 6.UV converter images at various distances, L, from the final amplifier: (a)–(c) without and (d)–(f) with an Xe cell inserted 5 m beyond the amplifier. The round spot in the panel (d) is a near-field image of IR radiation. Panel size is 4 × 4 cm2. USP peak power in the units of Pcr = 0.1 GW is shown in inserts. Intensities in images increase as the color sequence: purple, dark blue, blue, green, yellow, and red.
Typical USP spectra measured by an ASP 150T (Avesta Project Ltd.) spectrometer, with a resolution of 0.2 nm, are shown in Figs. 7(a) and 7(b) for various USP energies at L = 27 m and 95 m distances beyond the final amplifier. These spectra containes the main USP energy. Low-intensity wings symmetrically extended up to ±25 nm from the central laser wavelength were also observed in the spectra recorded at very low attenuation, and they contained a negligible fraction of the USP energy. The shaded region shown in Fig. 7 corresponds to H2O absorption spectra (Sec. III A). A significant transformation of the initial spectrum and broadening to the red wavelengths is seen with increasing USP energy and distance. Measurements with a high spectral resolution show a number of SRRS components belonging to N2, mainly for the J = 6 and J = 8 rotational states.31 For a propagation distance of L = 95 m, most of the laser radiation initially in the range of 248–249 nm is redshifted. In addition, off-axis, scattered radiation at an angle of ∼1.5 × 10⁻² rad was observed in these experiments due to SRRS, which contributed most to USP attenuation.
Figure 7.USP spectra (a) L = 27 m beyond the final amplifier for energies 5 (1) and 100 mJ (2); (b) L = 95 m beyond the final amplifier for energies 2.5 (1), 8 (2), 30 (3), and 70 mJ (4). A shaded region corresponds to H2O absorption shown above the graphs.
The observed USP spectral transformation might switch off the resonance mechanism discussed in Sec. III A at long propagation distances, and thus interrupt filamentation. Filamentation disappearance, however, is more likely to be caused by a loss of laser-beam coherence due to self-phase modulation (SPM) in filaments, ≫ 1 (generally called a B-integral), for which the intensity is two orders of magnitude larger than the intensity of the background radiation (Sec. III A). Therefore, a difference in optical lengths for filaments and background radiation would increase with length as Δ = n2IfL. Moreover, for radiation with spectral width Δλ, the coherence length is expressed by the formula Lcoh = λ2/2Δλ. The limiting length, , for the coherence of a beam containing multiple filaments can be found from Δ ≤ Lcoh: . For λ = 248 nm, Δλ ≈ 2.5 nm (Fig. 7) and n2 = 10−18 cm2 W−1; the filamentation-ending length is ≈ 60 m, in accordance with experimental observation.
IV. SUPRESSION OF MULTIPLE FILAMENTATION AND ITS EFFECT ON BEAM DIVERGENCE
The suppression of laser-beam filamentation is an important issue, firstly, in the lifetime operation of a KrF laser facility with a maximum USP energy, and secondly, in preventing probable laser-beam deterioration during long-distance propagation from the final amplifier exit to the irradiated target.39 Following Lehmberg et al.,36 we employed Xe to compensate for a nonlinear phase incursion along the USP amplification pass in air and in the amplifier windows.59 Xe has a large negative two-photon, resonantly-enhanced, nonlinear refractive index, n2, at λ = 248 nm which absolute value is 70-fold higher than of air.
A. Self-defocusing of multiple filaments in xenon
An Xe-filled cell was set at L0 ≈ 20 m distance from the output of a (2 + 2) amplification scheme, where the beam of 6 cm in diameter was fully filamented (L0 ≥ ≈ 15 m). The beam passed into a gas cell of 2.5-m length through the entrance of a 1-cm thick CaF2 window with a diameter of 9 cm, while an exit window made of K8 glass served as a fluorescer for the UV beam converter [Fig. 8(a)].
Figure 8.Layout of experiments on (a) filaments defocusing in Xe cell and (b) multiple filamentation suspension.
Figures 9(a)‒9(c) compare distributions obtained for the same part of the beam in the case of (a) a cell filled with atmospheric air, (b) a cell evacuated to ∼10−5 atm, and (c) a cell filled with Xe at 0.1 atm pressure.
Figure 9.The same fragment of the laser beam cross-section for the USP passed through a cell (a) filled with air, (b) evacuated to 10−5 atm, and (c) filled with Xe at 0.1 atm. (d) Corresponding intensity profiles in selected filaments highlighted by a white circle (1) in air, (2) vacuum, and (3) Xe. For clarity, the curves have been moved along the vertical axis. Intensities in images increase as the color sequence: purple, dark blue, blue, green, yellow, and red.
The pronounced effect of equalization of the intensity distribution is evident, even for a rather low Xe pressure; the defocusing of a single, occasionally selected filament (highlighted by a white circle) from the entire array is demonstrated in Fig. 9(d). In a stochastic, multiple-filamentation pattern, filaments are distributed along cellular diffraction fringes (see Sec. III A). Although filament distribution is almost fully reproduced (it is determined primarily by the block structure of the output amplifier window), filament diameter in the pumped-out cell increases by a factor of 1.7, as Kerr self-focusing is switched off. In the case of the Xe-filled cell, filament diameter increases by a factor of 3.6.
A quantitative analysis of the radial evolution of an individual filament w(z) along the cell can be done on the basis of a paraxial approximation for the Gaussian beam radius:60where w (z = 0) = w0 is the filament radius in air, i.e., approaching the cell entrance; is the Rayleigh range of a supposed Gaussian distribution of filaments; k = 2πn0/λ = 2.5 × 10⁷ m−1 is the wave number of the laser wavelength, λ = 248 nm; n0 ≈ 1 is the refractive index of the medium in the cell; and Pf (z) is the peak power of the filament along the cell. In vacuum, Pcr → ∞, and Eq. (2) is reduced to the well-known expression for diffraction of a Gaussian beam. For a radius of output filament w (z = 2.5 m) ≈ 1.7w0, one can obtain z0 = 1.8 m and w0 = 280 µm, which gives = 330 µm in agreement with experiment.
As Xe has a negative, nonlinear, refraction coefficient, , the critical power, , is formally negative. Assuming that filament power does not change significantly along the cell, then the ratio in Eq. (2), = −6.9 for , = 1.2 × 10⁻¹⁸ cm2 W−1 (from Ref. 61), and = −8.5 × 10⁻¹⁸ cm2 W−1 at 0.1 atm of Xe.36 Thus, filament radius at the end of the cell can be estimated as wXe(z = 2.5 m) = 3.9w0, in qualitative agreement with measured values. Therefore, filaments are defocused significantly.
The fraction of UV radiation lost in the Xe cell (without accounting for the Fresnel reflection of the entrance window) increased with gas pressure and reached ∼20% at 1 atm, apparently caused by nonlinear interactions between high-intensity filaments and Xe. For example, filament propagation was accompanied by narrow-angle, monochromatic, coherent cone emission at 828 nm, which can be explained by stimulated hyper-Raman scattering, four-wave mixing, and ASE by the transition of atomic Xe.62 A coherent nature of red emission was proved by a speckle structure and interference;59 these evidenced a phase matching of filaments not very far from the final amplifier output. Nonlinear scattering in the CaF2 entrance window of the cell is observed in Fig. 9, in the form of rings surrounding filaments.
B. Suspension of filamentation onset by xenon
Since xenon defocuses filaments, there are some other issues that require investigation: (i) is it possible to prevent multiple filamentation of a supercritical USP beam by moving the Xe cell closer to the final amplifier than the typical length of filamentation onset, ≈ 15 m?; and (ii) how long will a filamentation-free USP propagation length in air beyond the cell be? To investigate these issues, we replaced the output window of the cell with a transparent one, and set the cell filled with 1-atm Xe at 5 m distance from the amplifier output [see Fig. 8(b)]. Beam profiles were measured at various distances, L, from the amplifier along the 100-m air pass. We believed that a negative, nonlinear phase shift in Xe would compensate for a positive one in air and CaF2 cell windows. Thus, the filamentation onset would be postponed until a longer distance, determined by the condition .
The obtained beam patterns are shown in the bottom panels of Figs. 6(d)‒6(f) and are compared with patterns without the Xe cell. USP peak power indicated in the panels accounts for the Fresnel reflection of CaF2 cell windows for the same initial USP energy, E0 ≈ 0.2 J, and the attenuation law. In the absence of filaments, energy loss in Xe was negligible. At L = 27 m, Xe eliminates multiple filamentation and provides decent homogenization of the beam. A perfect bright circle in the panel of Fig. 7(d) is an image of the accompanying IR emission from Xe. Although containing negligible energy (below calorimeter sensitivity) the circle looks bright because being transmitted through the UV converter directly illuminates the CCD matrix. As the distance is increased to L = 60 m, a few filaments of a larger size but with less areal density appear in the beam pattern. At a larger distance, L = 95 m, filamentation with the Xe cell is clearly seen in contrast with the beam pattern without the cell, where filamentation already disappears (Sec. III D). Thus, the Xe cell allowed us to postpone filamentation by several dozen meters due to a negative SPM of the beam in Xe.
C. Effect of filamentation on laser-beam divergence and focusability
As random phase shifts in filaments might considerably increase the filamented beam divergence and focusability on a target, we examined these issues. A cell of 1 m length, filled with Xe at a pressure of 1 atm, was placed 5 m away from the final amplifier. Angular distributions of the laser beam passing through a cell or without a cell were measured at L ≈ 15 m from the (2 + 2) scheme output, where without the cell, a complete filamentary structure of the beam was formed (Sec. III A). Using an F = 2.5 m spherical mirror, laser radiation was focused onto the UV converter located in the focal plane. To avoid glass ablation, only ∼4% of the USP energy was directed to the converter by a CaF2 wedge set near the focus. A set of neutral optical filters attenuated glass fluorescence, allowing us to investigate both the most intense, central part of the focal spot [Fig. 10(a)] and its far periphery, while the central part got oversaturated [Figs. 10(b) and 10(c)]. Interference fringes in the periphery of the focal spot were likely caused by diffraction at the Xe cell aperture, but may have been caused by nonlinear UV radiation scattering in Xe or CaF2 windows (see Sec. V).
Figure 10.UV converter images of the USP passing through an Xe cell and focused by an F = 2.5 m spherical mirror, with various attenuations of fluorescence: (a) a central part and (b) and (c) the periphery of the spot with oversaturated central part. Intensities in images increase as the color sequence: purple, dark blue, blue, green, yellow, and red.
Three fluorescence profiles were cross linked to obtain the fluorescence distribution over four orders of magnitude [Fig. 11(a)]. To take into account a small astigmatism introduced by the spherical mirror slightly turned off the beam axis, the fluorescence profiles were averaged in two mutually perpendicular directions and recalculated into the intensity distribution of the UV radiation using a calibration curve (Sec. III A). The angular distribution of radiation that passed through the Xe cell with variation of over eight orders of magnitude is shown in Fig. 11(b). By integrating the angular distribution, a fraction of energy in a given angle was calculated. The same procedure was done for the filamented laser beam without a Xe cell, and the obtained angular distributions are compared in Fig. 11(b).
Figure 11.(a) Intensity distribution of radiation passed through the Xe cell in the focus of the F = 2.5 m mirror and (b) Gaussian approximation of angular distributions for the USP passed through Xe and air.
A divergence of the beam smoothed in Xe cell was 0.14 mrad at the 0.1 level of the maximal intensity. This angle contained a ∼0.5 fraction of the total USP energy. Without the cell, divergence of the filamented beam was only higher by 15–20%. Therefore, all filaments in the laser beam should be phase matched to provide a divergence close to that of a homogenized beam. Such a situation changes at a large distance, where nonlinear phase-shifts in filaments destroy beam coherence (Sec. III D). The measured beam divergence was presumably dependent on the fabrication accuracy of the large-scale amplifier windows and other optical components of the amplification pass.
V. NONLINEAR INTERACTION OF KRF LASER RADIATION WITH OPTICAL WINDOWS
Various optical materials suitable for KrF laser optics were investigated with respect to their transmittance for powerful UV radiation.63‒66 CaF2 appears to be the most appropriate material for KrF USP amplifiers: It is stable in respect of chemical reactions with molecular fluorine and irradiation by scattered electrons and hard bremsstrahlung X-rays produced under deceleration of pumping electron beams;47,48 moreover, it has high transparency, even for high power USPs, since nonlinear absorption in CaF2 proceeds via a three-photon mechanism, in contrast with the two-photon absorption in fused silica, which is commonly used in KrF lasers. As CaF2 crystals can be grown to a large size and have a high enough mechanical strength to withstand elevated pressure in a laser chamber, they are the best choice for amplifier windows.
A. Modeling experiments on nonlinear interaction of UV radiation with CaF2 samples
It was shown in Sec. III C that the appearance of multiple filaments in a supercritical laser beam strongly affected the transmittance of CaF2 optics. Modeling experiments were performed at the third harmonic of a Ti:sapphire front-end, with a wavelength λ ≈ 248 nm and USP length of 100 fs (FWHM), on the interaction of UV radiation with CaF2 across a large intensity range of 7 × 10⁹–7 × 10¹¹ W cm−2. A typical intensity of atmospheric air filaments in a supercritical KrF laser beam of ∼2 × 10¹¹ W cm−2 falls within this range. Radiation was focused by a F = 2 m lens in the 2-cm thick CaF2 sample, which was approximately equal to amplifier-window thickness. The sample was placed in the beam waist at a distance of ∼8 cm in front of the focal plane [Fig. 12(a)], so that the measured beam diameter of ∼300 µm (FWHM) was approximately equal to the average diameter of a filament in a supercritical USP beam. The radiation incident on the sample was 100-fold attenuated step-by-step from the maximum value of 0.1 mJ (the corresponding peak power was P ∼ 1 GW) using a diffraction attenuator. Therefore, in modeling we reproduced the conditions for the propagation of individual filaments through an amplifier window (Sec. III C) with a much wider range of peak powers; these powers obviously exceeded the critical power, Pcr ≈ 3.3 × 10⁵ W, for self-focusing in CaF2. Experimental data from Ref. 67 were used: n0 = 1.47; n2 = 1.9 × 10⁻¹⁶ cm2 W−1.
Figure 12.(a) Layout of CaF2 transmittance measurements: 1–focusing and collecting lenses, 2–CaF2 sample, 3–iris aperture, 4–spectrometer: (I) transmitted radiation without the sample and (II) with the sample; (b) normalized spectra of 0.75 GW USP passed through (1) air and (2) CaF2 sample; line segment designates the KrF gain band of ∼2.5 nm; (c) experimental dependence of CaF2 transmittance on the incident USP intensity with approximation; filaments intensity range is shadowed.
We observed significant scattering of USPs transmitted through the CaF2 sample. Therefore, for CaF2, nonlinear absorption measurements relevant to USP amplification radiation were passed through an iris aperture and collected with a lens at the entrance slit of a spectrometer ASP-150. The obtained spectra were then compared with a spectrum of the USP without a sample. The aperture size was adjusted to the radiation divergence angle behind the beam waist in the absence of the sample. As some absorption and scattering of focused radiation might be expected in air, the minimum aperture that allowed all USP energy to pass through it was chosen to be ∼10−2 rad, by varying aperture diameter and setting a calorimeter in front of the beam focus and behind the aperture. The calorimeter readings were within acceptable accuracy limits (we used here the maximum USP energy available without any attenuation). With USPs of varying energy, the integrals over the obtained spectra in air (without the sample) linearly depended on the incident energy. By integrating the radiation spectra transmitted through CaF2 and comparing them with those in air, total losses due to nonlinear absorption and radiation scattering outside the aperture were measured. Such a procedure excludes error arising from using a photodiode (when a sensitivity higher than that of a calorimeter is required), which typically has a strong spectral dependence in the UV region; radiation spectral broadening has been shown to give systematic errors.
The spectrum in air has a central maximum around the laser wavelength, with a width of Δλ ∼ 2 nm (FWHM) and broad low-intensity wings, built up from the central wavelength by ∼10 nm [Fig. 12(b)]. Whilst SRRS broadened the central maximum by a factor of 2, relative to the initial spectrum, the stimulated Raman scattering (SRS) by the vibrational levels of air species could create the wide wings’ appearance. Similar low-intensity wings were also observed in the spectra of sub-TW power USPs during long-distance propagation in air. The wings could also be generated via a high-intensity SPM nonlinear process.38 In the case of radiation passing through the CaF2 sample, a rather large fraction of energy (up to several tens of percent) was redistributed into broad wings. As a result, the spectrum width ∼20 nm (FWHM) greatly exceeds the gain band of the KrF amplifier (∼2.5 nm) designated by a horizontal line segment in Fig. 12(b). In addition to the wings, there is a strong broadening of the central maximum, and several peaks appear, which correspond to the SRS of different orders in the CaF2 crystal.68,69 In the case of air at a USP power of 0.75 GW (incident intensity 5.2 × 10¹¹ W cm−2), about 50% of the transmitted radiation falls outside the KrF gain band; whereas for radiation passing through the CaF2 sample, more than 90% of the total pulse energy is outside the gain band. Therefore, in addition to nonlinear absorption and radiation scattering, there are indirect losses due to spectral extra-broadening, in excess of the amplification band.
CaF2 transmittance obtained from treatment of the spectra is shown in Fig. 12(c). These measurements accounted for losses due both to three-photon absorption and scattering into large angles exceeding ∼10−2 rad (angular width of the aperture). Significant nonlinear losses occur for the incident intensity I ∼ 1011 W cm−2. For maximal intensity, I = 7 × 10¹¹ W cm−2, sample transmittance falls to ∼10–15%. Experimental results are approximated by an attenuation law for three-photon absorption, (where I0 is incident intensity, γ is a three-photon absorption coefficient, and l is sample thickness), accounting for a Gaussian temporal and spatial intensity distribution. The best fit, designated by a solid line in Fig. 12, was obtained for γ = 4.5 × 10⁻²³ cm3 W−2. This value is close to one previously measured at 3.8×10⁻²³ cm3 W−2 for a KrF USP with a 450-fs pulse length66 and much less than γ = 2.0 × 10⁻²¹, measured for an 8-ps USP.65
The radiation scattered at larger angles, measured with an enlarged aperture, contained Stokes and anti-Stokes SRS components, with Raman shifts 120 cm−1, 157 cm−1, 218 cm−1, 289 cm−1, 321 cm−1, and 332 cm−1, most of which are well-known in the literature.68,69 Overall, the divergence of transmitted radiation through the CaF2 sample increased by a factor of three compared with that through air. The strong USP scattering in CaF2 was likely due to the high-order SRS and nonlinear refraction.
B. Evaluation of CaF2 window transmittance for a supercritical multiply filamented laser beam
To evaluate losses of a multiply filamented laser beam passing through amplifier windows, we assume that, according to Sec. III A, a USP of energy 0.2 J and peak power 0.2 TW contains about 300 filaments with a peak intensity If ≈ 2 × 10¹¹ W cm−2 and energy density εf ≈ 0.2 J cm−2 (larger by a factor of 100 compared with that averaged over the beam cross-section) which carry ξ ≈ 30% of the total energy. When the above γ value is applied to the averaged beam intensity, no nonlinear absorption and off-axis large-angle scattering arises in the 3-cm thick CaF2 window of the final amplifier; but for high-intensity filaments, the nonlinear loss in each filament is estimated to be ∼70%. As γ accounts for nonlinear scattering outside an angle of ∼10−2 rad, the fraction of radiation staying within the angle of the laser-beam divergence [∼10−4 rad (Sec. IV C)] should be significantly less in comparison with the incident radiation; this means that energy contained in filaments is reduced to the background level. Thus, during filament formation in the amplification pass, only background radiation passes through the amplifier windows. Accounting for Fresnel reflection, window transmission should be about 60% in coincidence with a direct measurement of the amplifier window transmittance for a multiply filamented beam.
In the above estimate, we assumed the USP beam-profile inside the window was identical to the one in air. As the critical power of radiation self-focusing in CaF2, Pcr ≈ 3.3 × 10⁵ W, is three orders of magnitude lower than critical power in air, this assumption at first glance contradicts the existing views about multiple filamentation, according to which individual filaments carry radiation power close to the critical one. So, one might expect an increase in both the number of filaments and the total power fraction carried by them; but no such power redistribution is observed in Fig. 13, where a side view of filament fluorescence is shown during filament propagation through the 2-cm thick CaF2 sample. Instead, we observe filament damping caused by three-photon absorption and nonlinear scattering.
Figure 13.Side view of CaF2 fluorescence under the propagation of multiply filamented beam.
In the present research we summarize the critical issues of nonlinear optics of high-power UV laser beams, which will be addressed when an SI ICF scheme, with e-beam-pumped, high-power KrF amplifiers, is implemented. Angular multiplexing/demultiplexing schemes, with a typical pulse-propagation length of ∼100 m, are commonly used in such installations to match hundreds of temporally profiled nanosecond pulses with amplifier pumping times of a few hundred nanoseconds. To eliminate nonlinear effects, vacuum beamlines can be used to transport individual beams with multiTW peak power, and to combine them on the target. Otherwise, when using air beamlines as is currently the case, a multiple beam filamentation occurs in atmospheric air if radiation power exceeds a critical value of Pcr ≈ 0.1 GW. Hundreds of filaments concentrate extra-high peak intensity If ∼ 2 × 10¹¹ W cm−2 and energy density εf ∼ 0.2 J cm−2 (for picosecond pulses), which are two orders of magnitude larger than the average values in the laser beam. These would provoke negative consequences, such as premature saturation of a gain medium in KrF amplifiers, multiphoton absorption, nonlinear scattering of laser radiation, and spectral extra-broadening in amplifier windows beyond the gain bandwidth, as well as window damage and gradual loss of transmittance due to color-center accumulation.
All these issues are investigated at the multistage hybrid Ti:sapphire–KrF GARPUN-MTW laser facility, producing single picosecond pulses of ∼1 TW peak power or short-pulse trains with time intervals of a few nanoseconds. There is a range of multiple filaments in a collimated beam when it propagates in laboratory air for about 60 m, while termination of filamentation occurs due to loss of beam coherence by SPM. We expect that the induced spatial incoherence technique implemented for smooth target irradiation will be able to suppress beam filamentation, even at a supercritical peak power, larger by many orders of magnitude than Pcr. Laser-beam homogenizing over longer propagation distances is accompanied by radiation spectral broadening due to stimulated Raman scattering by the rotational transitions of atmospheric nitrogen, which can be useful for target-irradiation smoothing. At shorter distances, close to the filamentation onset, filaments are phase matched and filamentation has a minor effect on laser-beam divergence and focusability. The least desirable scenario is when filaments arise in the amplification pass between amplifiers. In this case, the filamentation onset can be suspended by using a xenon cell. Due to a large, negative, resonantly-enhanced, nonlinear refractive index, the absolute value of which exceeds that of air by a factor of 70, Xe is shown to defocus filaments if they already exist or to suspend their appearance.
References
[1] V. A. Shcherbakov. Ignition of a laser-fusion target by a focusing shock wave. Sov. J. Plasma Phys., 9, 240(1983).
[28] Y. Matsumoto, I. Matsushima, I. Okuda, Y. Owadano, E. Takahashi, K. A. Tanaka, D. D. Meyerhofer, J. Meyer-ter-Vehn et al. KrF laser program at AIST. Inertial Fusion Sciences and Applications 2001, 465-469.
V. D. Zvorykin, A. V. Shutov, N. N. Ustinovskii. Review of nonlinear effects under TW-power PS pulses amplification in GARPUN-MTW Ti:sapphire-KrF laser facility[J]. Matter and Radiation at Extremes, 2020, 5(4): 045401