
Silvano Donati, Michele Norgia. SNR improvement of 8.2 dB in a self-mixing laser diode interferometer by using the difference signal at the output mirrors [Invited][J]. Chinese Optics Letters, 2021, 19(9): 092502
- Chinese Optics Letters
- Vol. 19, Issue 9, 092502 (2021)
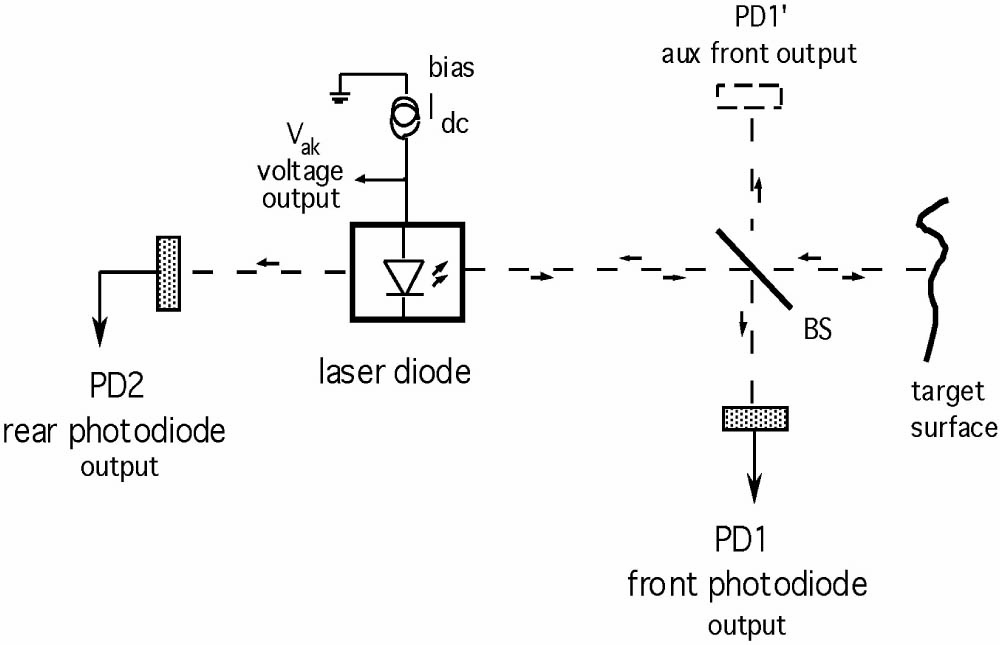
Fig. 1. Different pickups of the output signal from an SMI: from rear PD2 and from front mirrors PD1 and PD1′.
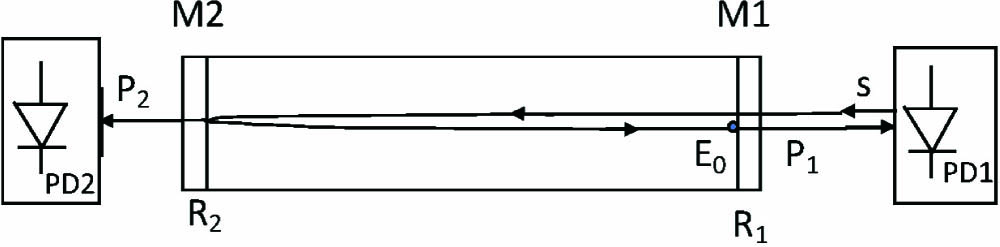
Fig. 2. Simplified scheme of an SMI for the evaluation of front and rear output signals and noise.
Fig. 3. Top: the laser diode cavity has mirrors with (power) reflectivity R1 and R2, and the optical oscillating field E0 is assumed constant inside the cavity; bottom: the second-quantization model, in which field E0 is accompanied by the coherent state fluctuation ΔEcoh, and the vacuum state fluctuations ΔEvac1,2 enter in the unused port of the mirrors, described as a BS because they have non-unitary transmission.
Fig. 4. (top) Pickup of the front SMI signal by means of a BS, deviating a fraction RBS of power P1 to PD1; (bottom) equivalent circuit for the evaluation of noise, showing the added fluctuation ΔEvacBS entering in the unused port of the BS.
Fig. 5. Portion a′ of the beam outgoing from mirror M1 by means of a reflecting prism.
Fig. 6. Balancing of the two SMI signals detected by PD1 and PD2: a triangular waveform is applied to the bias and generates detected responses brought to be nearly identical (top trace), that is, with a residually small difference (bottom trace).
Fig. 7. Signals detected by PD1 and PD2 (red and blue) and their difference (yellow), exhibiting a noise 2.5 ± 1 dB smaller.
Fig. 8. Peaks of EMI superposed to the SMI of channels PD1and PD2 (yellow and yellow–green) and the difference channel (red), exhibiting a disturbance reduction of 25…30 dB.

Set citation alerts for the article
Please enter your email address
© Copyright 2018-2021 | Chinese Laser Press. All Rights Reserved 沪ICP备15018463号-20