
Xiangxiang Huang, Kai Feng, Lijie He, Jian Gong, Jiang Chen, Zhuguo Li. Microstructure and Copper Contamination Phenomenon of Laser Cladded Aluminum Bronze Coatings on Carbon Steel Surface[J]. Laser & Optoelectronics Progress, 2019, 56(5): 051401
- Laser & Optoelectronics Progress
- Vol. 56, Issue 5, 051401 (2019)
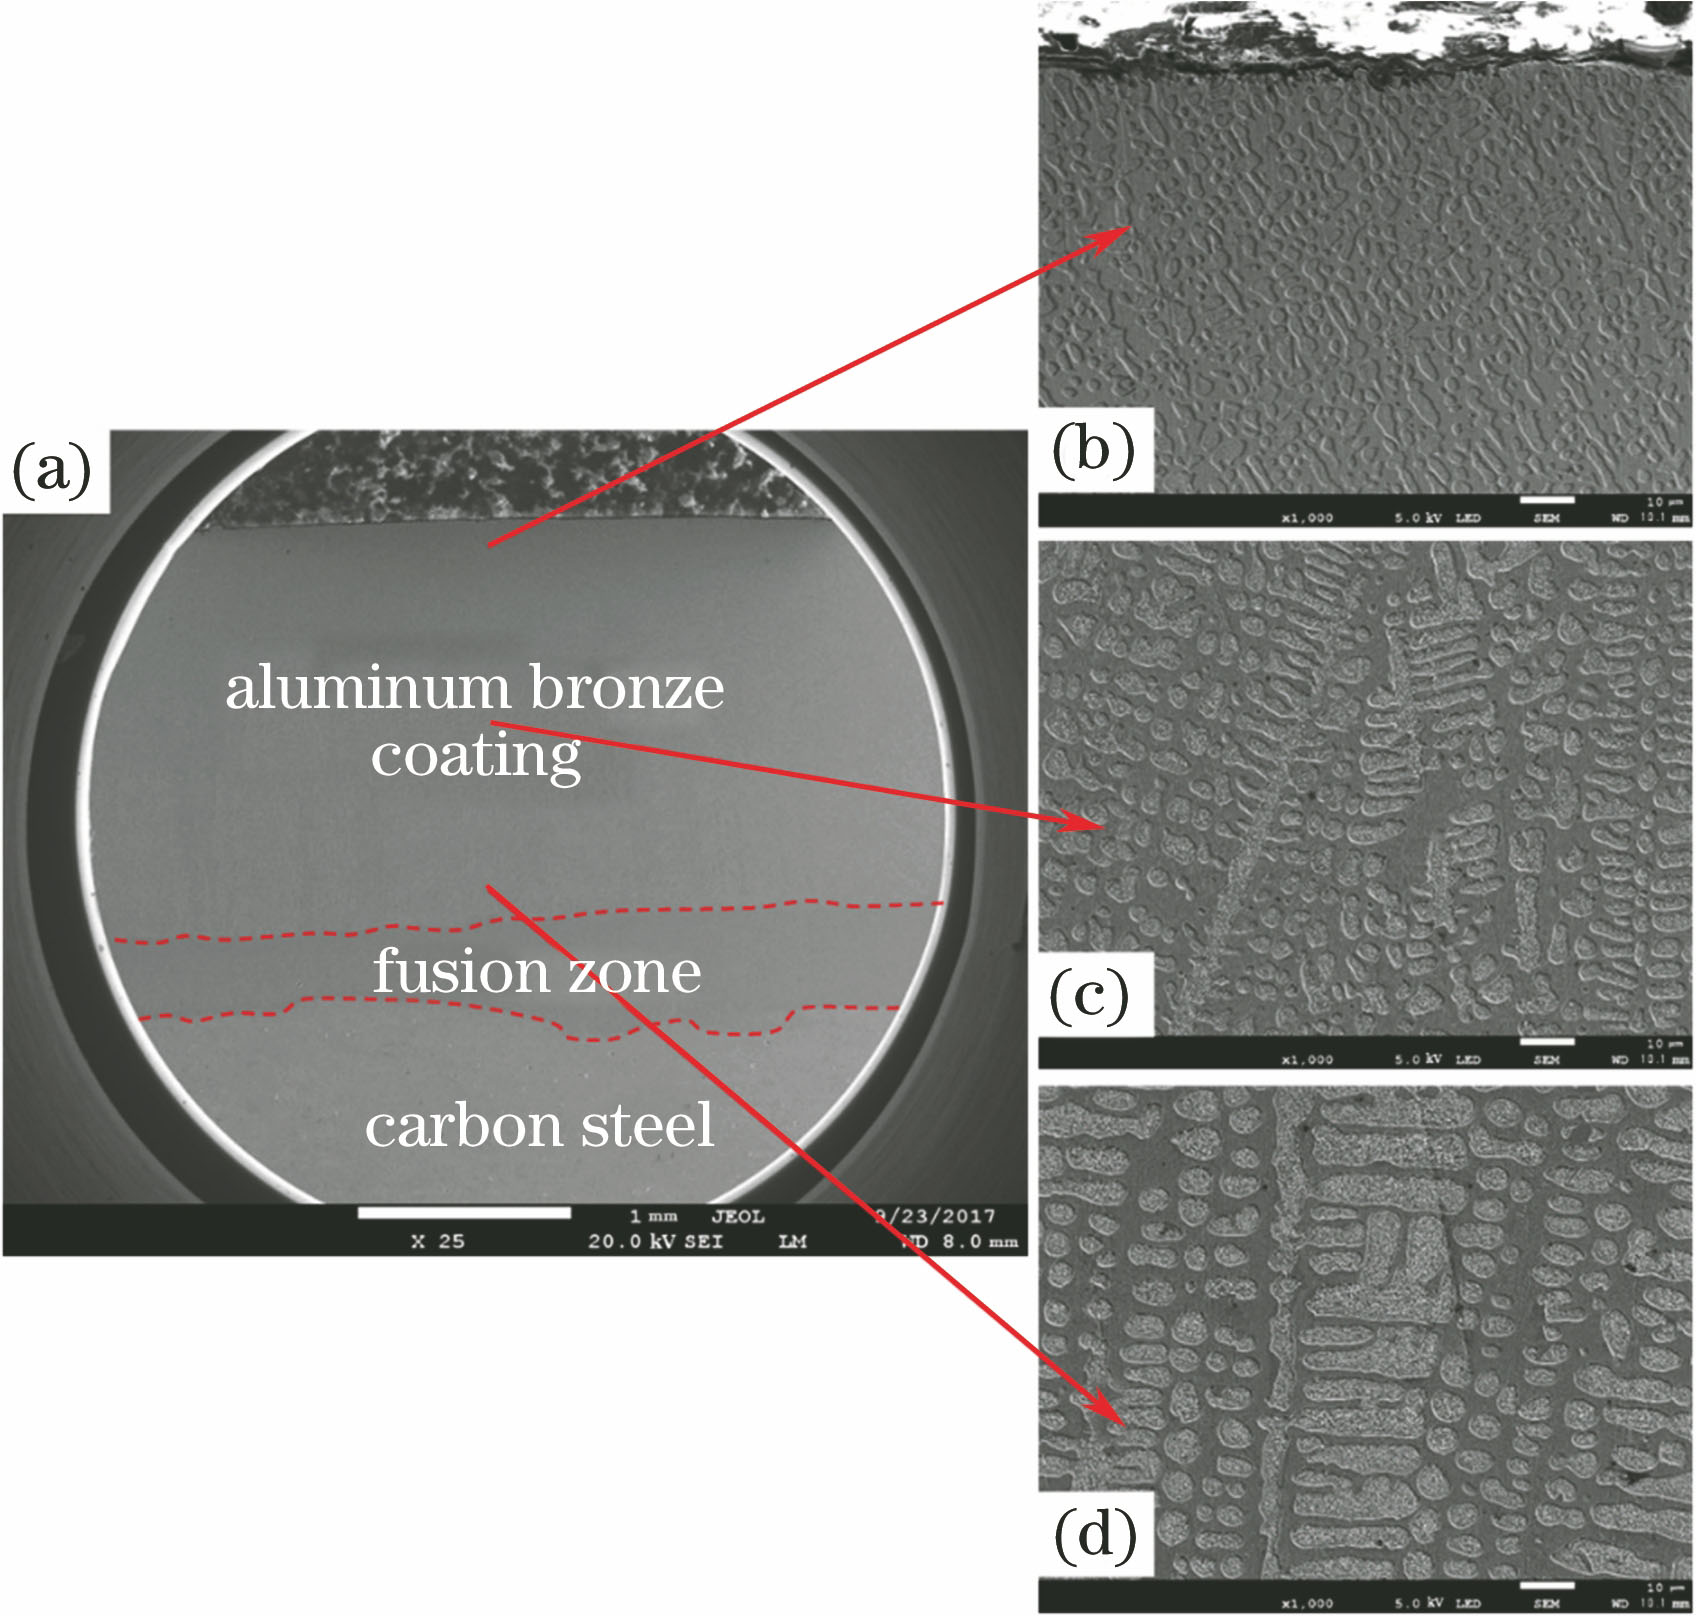
Fig. 1. Morphology of aluminum bronze coating. (a) Overall; (b) upper region; (c) middle region; (d) bottom region
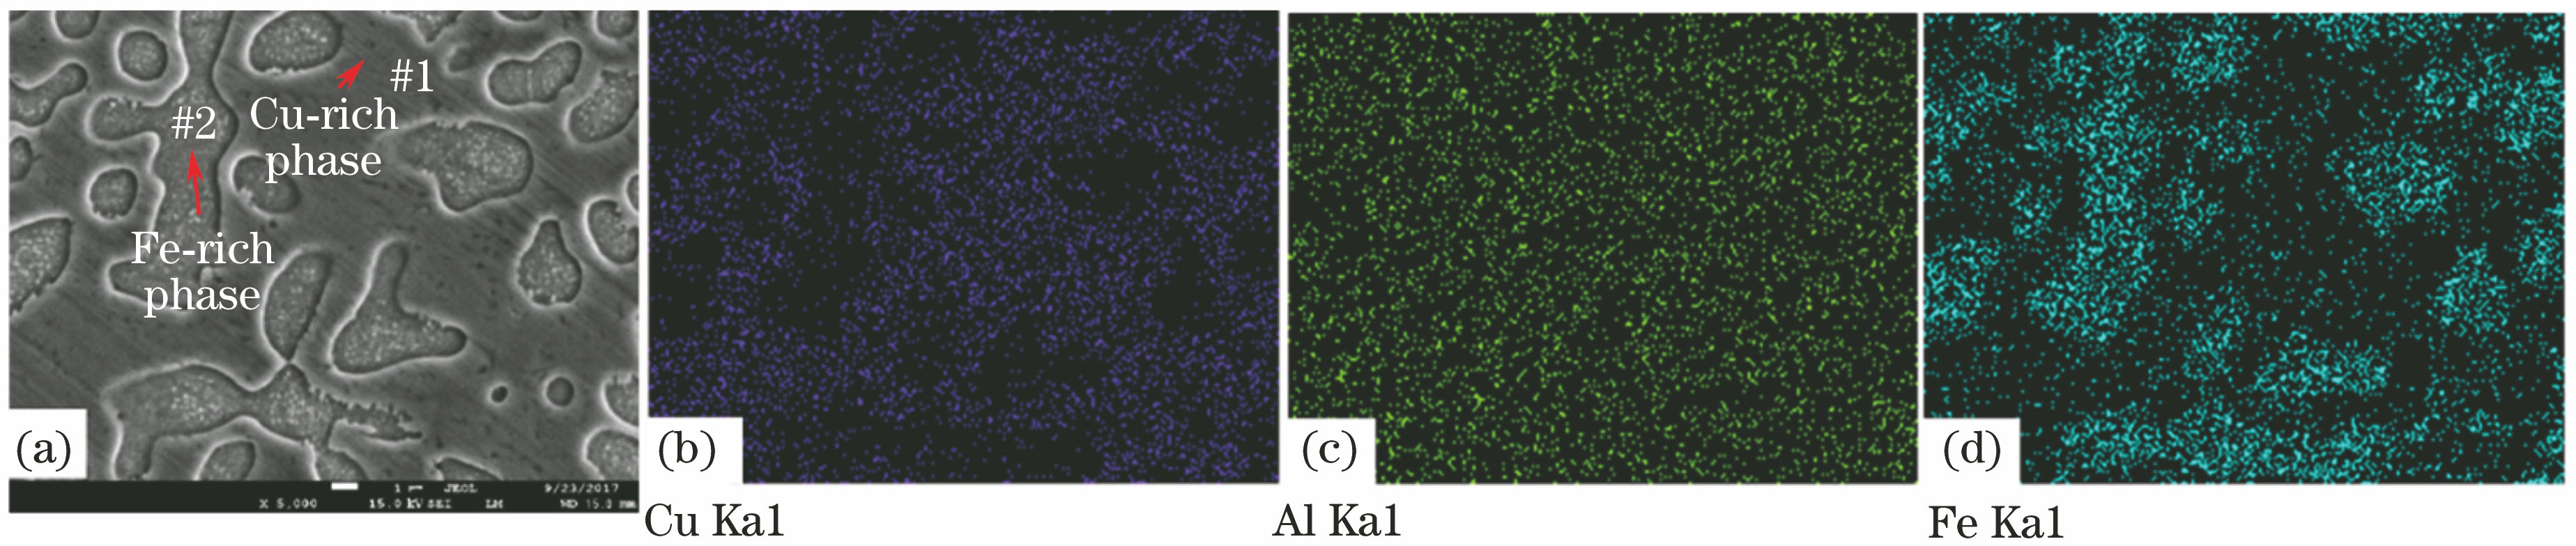
Fig. 2. Microstructure and element distribution in upper region of aluminum bronze coating. (a) Microstructure; (b) Cu; (c) Al; (d) Fe
Fig. 3. Magnified Fe-rich morphology
Fig. 4. XRD pattern of aluminum bronze coating surface
Fig. 5. SEM morphology of copper contamination and EDS analysis results of element distribution. (a) Copper contamination morphology; (b) #1 spot; (c) #2 spot; (d) #3 spot
Fig. 6. Schematic of wetting between α-phase grain boundary and molten β-phase
Fig. 7. Morphology of fusion zone and average depth of copper contamination under different laser parameters. (a) P=4 kW, s=4 mm·s-1, Q=12.5 g·min-1; (b) P=4 kW, s=3 mm·s-1, Q=12.5 g·min-1; (c) P=4 kW, s=2 mm·s-1, Q=12.5 g·min-1; (d) P=3.5 kW, s=2 mm·s-1, Q=12.5 g·min-1; (e) P=4.5 kW, s=2 mm·s-1, Q=12.5 g·min-1; (f) P=4 kW, s=2 mm·s-1, Q=15 g·min-1; (g) P=4 kW, s=2 mm·s-1, Q=10 g·min-1
Fig. 8. Width of fusion zone and average depth of copper contamination versus different process parameters. (a) Laser power; (b) scanning speed; (c) powder feeding rate
Fig. 9. Schematic of microstructure evolution and copper contamination under thermal cycle of laser cladding
| ||||||||||||||||||||
Table 1. Chemical compositions of Q235 base metal (mass fraction, %)
| |||||||||||||||||
Table 2. Chemical compositions of aluminum bronze powder (mass fraction, %)
| |||||||||||||||||||
Table 3. EDS analysis results of Cu-rich phase and Fe-rich phase (mass fraction,%)

Set citation alerts for the article
Please enter your email address
© Copyright 2018-2021 | Chinese Laser Press. All Rights Reserved 沪ICP备15018463号-20