
B. N. Hoffman, N. Savidis, S. G. Demos, "Monitoring and characterization of particle contamination in the pulse compression chamber of the OMEGA EP laser system," High Power Laser Sci. Eng. 11, 03000e39 (2023)
- High Power Laser Science and Engineering
- Vol. 11, Issue 3, 03000e39 (2023)
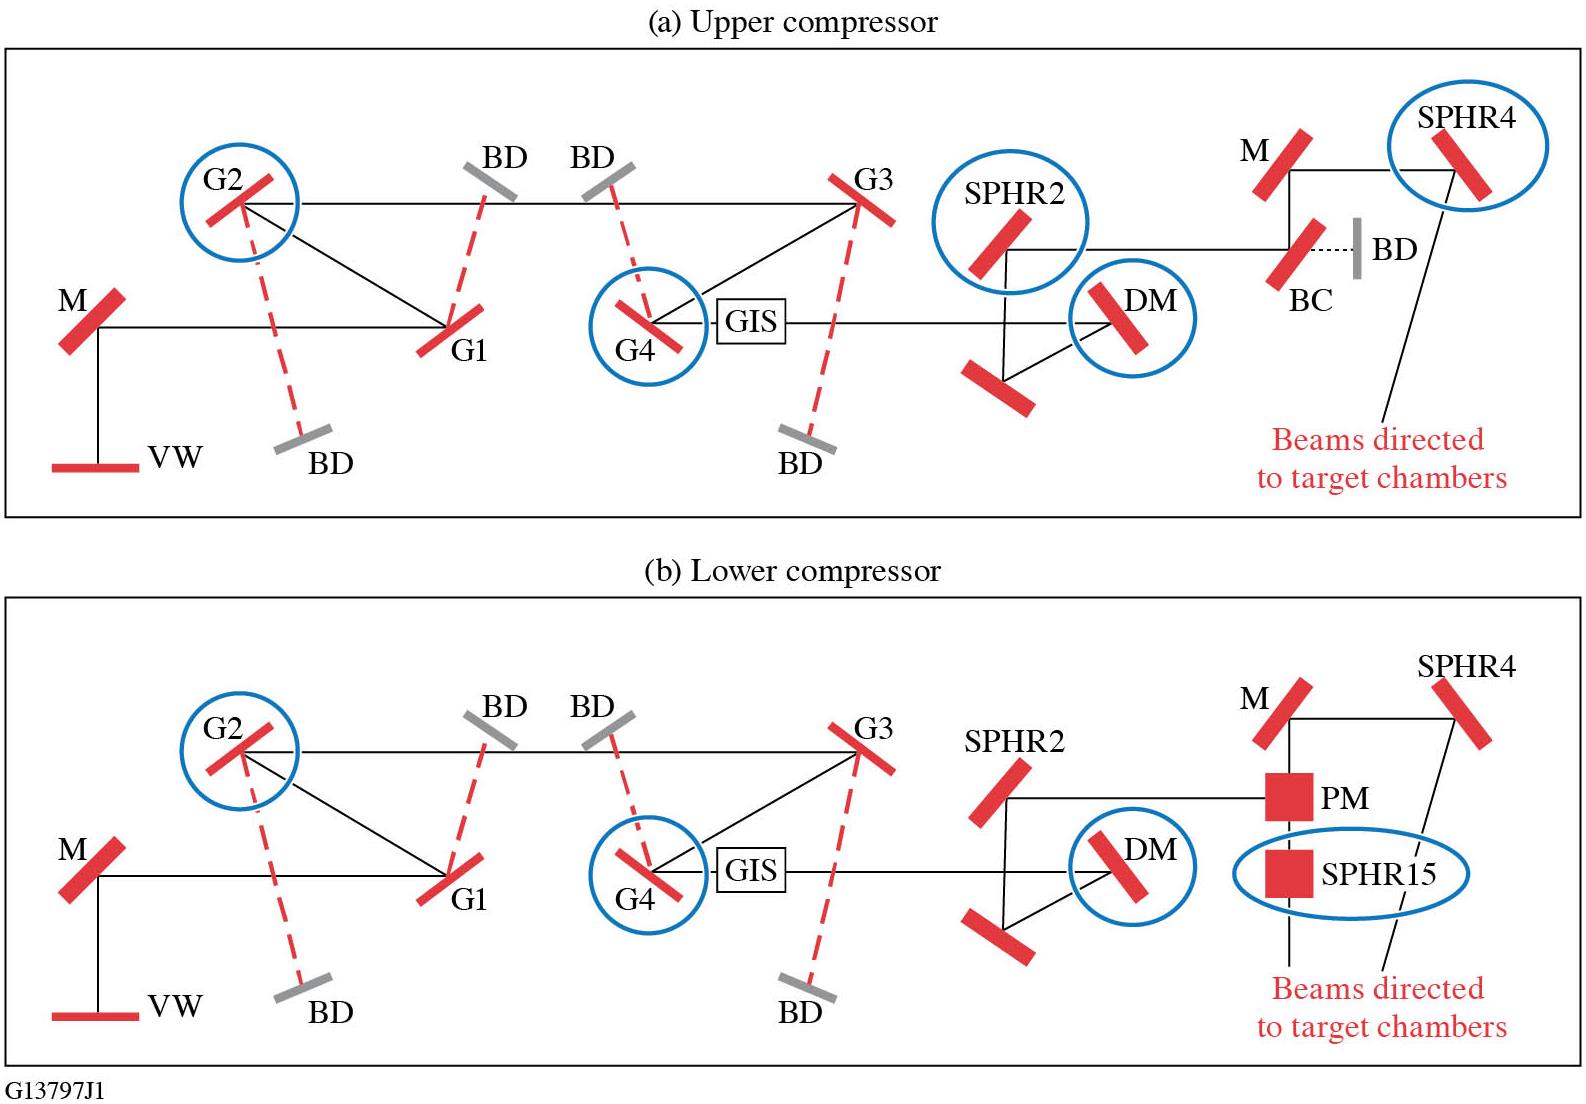
Fig. 1. Simplified schematic depicting the laser beam path of the (a) upper compressor and (b) lower compressor in the OMEGA EP GCC. The blue circles indicate the optics where collection substrates were adjacently positioned. VW, input vacuum window; M, mirror; DM, deformable mirror; G, grating; GIS, grating inspection system; PM, periscope mirror; BC, beam combiner; BD, beam dump.
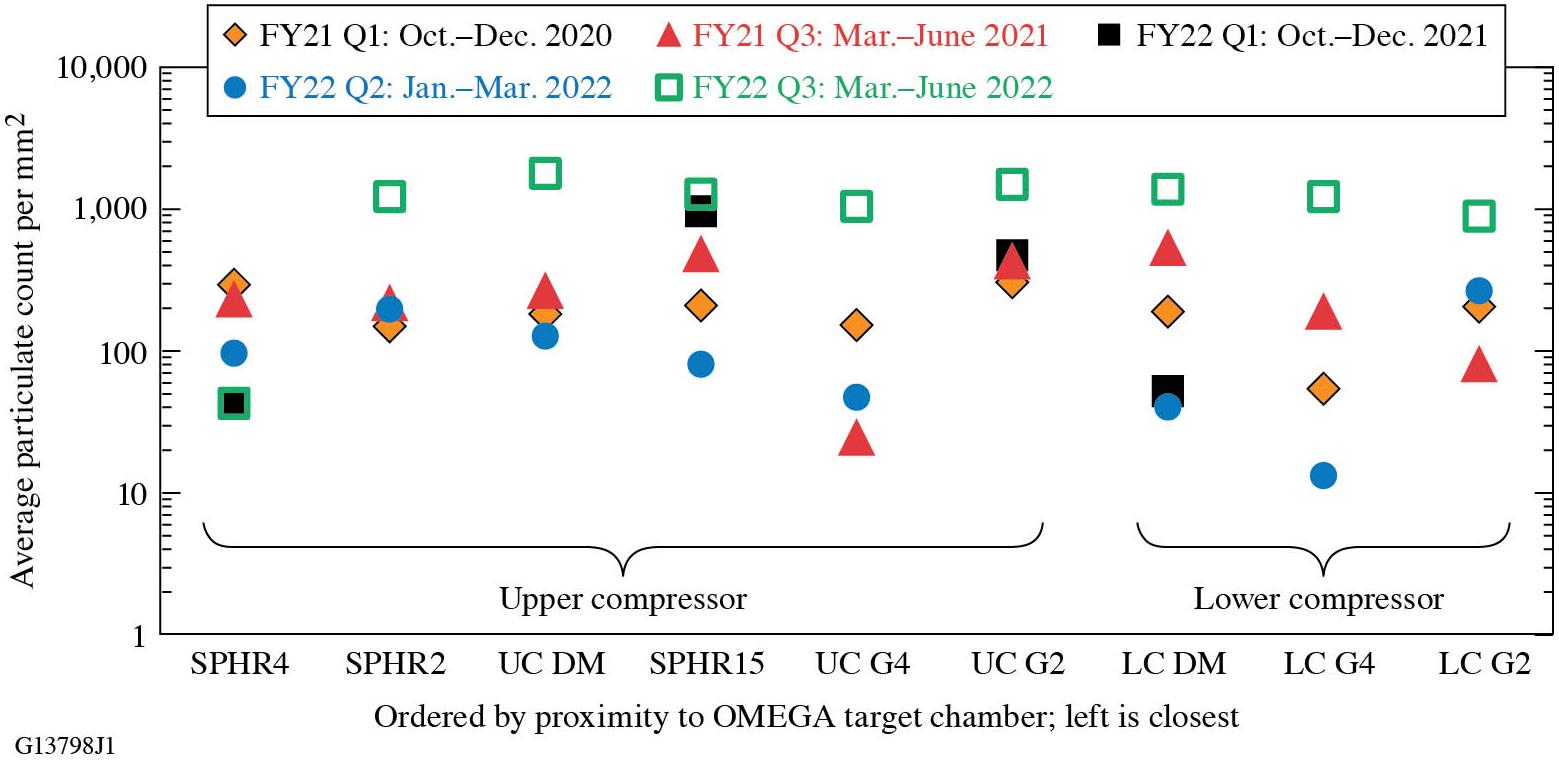
Fig. 2. Particle density on the uncoated collection substrates measured with the 10× objective for each location inside the OMEGA EP GCC over the course of the study.
Fig. 3. Particle diameter distribution histogram for each location for the FY22 Q2 operational period with samples imaged with the (a) 10× objective and (b) 50× objective. The histogram bin size for both magnifications is 0.25 μm.
Fig. 4. Scanning electron microscope (SEM) images of stainless-steel particles that were generated offline via mechanical shaving with a metal file. The particles have rough, distinct surfaces and edges.
Fig. 5. SEM images of stainless-steel particles that were generated offline via laser ablation with a 355-nm, 5-ns pulsed laser. Particles that were not droplets tended to have a foam-like texture, as shown in the inset.
Fig. 6. SEM images of different stainless-steel particles collected in the GCC vacuum chamber.
Fig. 7. SEM images of particles that are a conglomeration of smaller particles. (a1) SEM image of an aluminum particle with pieces of silicon attached on top. (a2) EDS map of elements for the particles in (a1). (b)–(e) Additional SEM image examples of particle conglomerations with elements identified.
|
Table 1. Composition distribution of particles characterized using energy dispersive X-ray analysis (EDS) for two operation periods, ‘FY21 Q4’ and ‘FY22 Q1’, and categorized as ‘total’, representing all identified particles found at different locations, and as ‘UC G2’, representing identified particles that were collected near the upper compressor G2.


Set citation alerts for the article
Please enter your email address

© Copyright 2018-2021 | Chinese Laser Press. All Rights Reserved 沪ICP备15018463号-20