
B. N. Hoffman, N. Savidis, S. G. Demos, "Monitoring and characterization of particle contamination in the pulse compression chamber of the OMEGA EP laser system," High Power Laser Sci. Eng. 11, 03000e39 (2023)
- High Power Laser Science and Engineering
- Vol. 11, Issue 3, 03000e39 (2023)
Abstract
1 Introduction
Since the advent of the laser era, extensive efforts have been devoted toward designing and manufacturing optics with a high laser-induced damage threshold (LIDT). In high-energy, short-pulse laser systems, the optics tend to be large, costly and difficult to replace. As a result, optimizing the manufacturing process, careful handling practices, cleaning procedures and a clean operational environment are recognized as important aspects to keep the optics as clean as possible throughout their lifetime. The principal reason for initiation of laser-induced damage in a ‘pristine’ optic is imperfections associated with the manufacturing process[1–4]. However, contamination due to the handling or the operational environment introduces additional challenges in maintaining the original performance of the optics during their lifetime[5–18]. This problem has been extensively investigated during the past 10 years for the case of nanosecond laser systems[18–24]. The impact of particle contamination in short-pulse laser systems has only recently received attention[25–27]. While most of the optics of concern in nanosecond laser systems are transmissive, optical elements for short-pulse laser systems are typically reflective and are based on metal or multilayer dielectric (MLD) coating designs. In reflective optics, the interference of the incoming laser field with scattered waves originating from particles gives rise to the generation of localized high electric-field intensity (EFI) and leads to laser-induced damage. This behavior was demonstrated in experiments that investigated the interaction of 10-ps and 600-fs pulses (at 1053 nm) with four different types of particle materials (stainless steel, borosilicate glass, low-density polyethylene and polytetrafluoroethylene) that are typically found in the operational environment of large-aperture systems[25,26]. The experiments demonstrated that the interaction of these model contamination particles (having a nominal diameter of 40 μm) with short pulses leads to discrete types of effects.
- 1.Damage on the top layer due to interference between the incoming laser field and scattered light by particles.
- 2.Damage on the optic due to microlensing (for transparent particles).
- 3.Secondary contamination of the optic due to ablation or disintegration of the particle. This secondary contamination leads to new damage or damage growth under subsequent irradiation.
- 4.Plasma-induced etching (scalding)[28,29] of the optic due to the formation of plasma, especially in locations where plasma is partially confined (such as near or under the particle).
The laser-damage process itself generates additional contamination via micro- and nanoscale debris, with a fraction of the debris scattered back onto the surface[30–34]. Additional known sources of particle contamination are associated with the handling and installation of the optics and particles generated by the ablation of containment walls and optics holders from focused ‘ghost’ beams[35]. Furthermore, there is a background particle load even in a clean room environment. For example, a class-1000 clean room facility contains about 300 particles per m3 with more than 5-μm radius, 8300 particles with more than 1-μm radius and 35,000 particles with more than 0.5-μm radius[36–38]. Particle contamination can be further aided by electrostatic charges that may be generated by electron and ion emission from the surface during laser irradiation[39–42].
The two OMEGA EP beams can be compressed for short-pulse operation between 0.7 and 100 ps. These beams currently provide 1053-nm light with up to 0.5 kJ in 0.7 ps, 1.25 kJ in 10 ps and 2.3 kJ in 100 ps, with a best focus of approximately 30-μm diameter containing 80% of the laser energy. The peak laser intensity is above 2 × 10²⁰ W/cm2, with an intensity contrast of approximately 1010. The final amplification and/or pulse compression stage in short-pulse laser systems, such as the OMEGA EP laser system, is typically directly connected to the target chamber (no physical barrier) during operation. Ablation byproducts of the target materials are known to produce significant amounts of particles. It has been shown that target byproducts to laser exposure can reach optics that are located outside the line of sight or bypass barriers positioned to protect optics[43]. It is therefore conceivable that particles generated at the target chamber can be transported toward the laser system, such as in the pulse compression sector.
Sign up for High Power Laser Science and Engineering TOC. Get the latest issue of High Power Laser Science and Engineering delivered right to you!Sign up now
Although these effects have not been investigated in adequate detail, there are preliminary reports that suggest this may not be uncommon. For example, a recently presented study on the damage behavior of gratings inside the grating compressor chamber (GCC) of the OMEGA EP laser system[44] over a 10-year period indicated a degradation in damage performance. It was suggested that this behavior may be associated with particle contamination. The present work is motivated by the above important considerations that can significantly affect the lifetime of critical optical components and the associated cost of operation of such laser systems. Specifically, a study was designed to perform a detailed survey of the OMEGA EP chamber in terms of the particle load and chemical composition over a period of 19 months and involved five vacuum chamber venting cycles. The results demonstrate that despite extensive efforts to minimize particle contamination in the OMEGA EP GCC, hundreds of particles per mm2 were found on collected samples located in front of critical optics. The majority of particles have diameters of less than or equal to 4 μm and are composed of metals, glass and carbon containing. The results indicate that the particle distributions change between operational periods. The working hypothesis is that particles are composed mostly of target materials that migrated into the GCC.
2 Experimental details
2.1 Collection samples
Particles were collected by placing collection substrates in front of key optics at nine specific locations inside the GCC. The GCC handles the compression of two separate beamlines with the corresponding optics located in the upper compressor (UC) and lower compressor (LC) assemblies[45,46]. Much of the GCC and the thousands of components located inside of the chamber are composed of metal. The GCC walls, many of the mechanical assemblies to hold optics and diagnostics and the infrastructure for personnel access to the chamber are made of various types of steel. Aluminum is the next most used metal inside the GCC and is often used for the frames and interface plates of beam dumps as well as driver unit shafts. Other metals are used sparingly inside the GCC.
The optical layout of the compressors and the key optics that collection substrates were placed in front of are depicted in Figure 1. Collection samples were positioned adjacent to optics located near entry points to the chamber (UC G2, LC G2); optics near the beam-transport tubes to the target chambers (SPHR4 and SPHR15); critical optics that see high laser fluence, such as the fourth grating in the compressors (UC G4 and LC G4), the UC deformable mirror (DM) and LC DM; and a diagnostic mirror (SPHR2). Each set of collection substrates was kept at these locations for a single quarterly vacuum cycle of about three months, which will be referred to as an operational period. These collection optics were the last objects to go into the GCC before pumping down the chamber and the first to be removed from the chamber after venting to the atmosphere. The GCC is pumped to a vacuum environment of approximately 2 × 10⁻⁶ Torr (1 Torr = 133 Pa) and it takes approximately three days for this process to be completed. When the GCC is vented to atmosphere, the process takes 3.5 h.
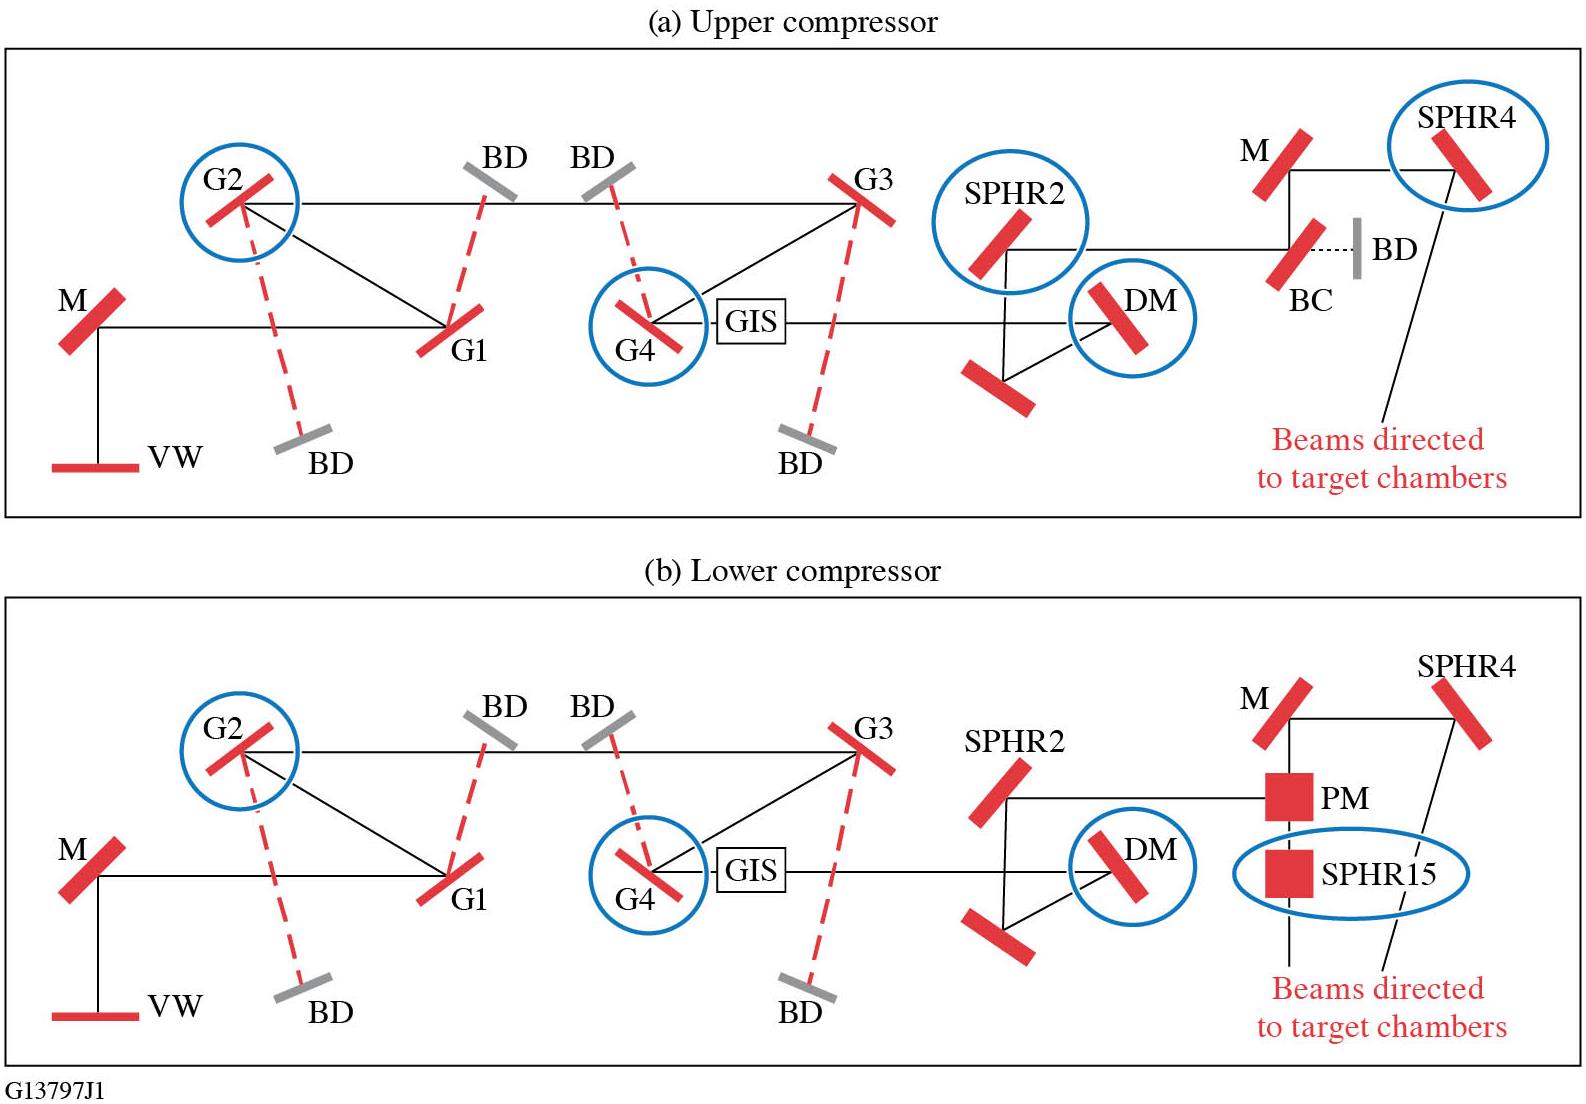
Figure 1.Simplified schematic depicting the laser beam path of the (a) upper compressor and (b) lower compressor in the OMEGA EP GCC. The blue circles indicate the optics where collection substrates were adjacently positioned. VW, input vacuum window; M, mirror; DM, deformable mirror; G, grating; GIS, grating inspection system; PM, periscope mirror; BC, beam combiner; BD, beam dump.
The collection substrates used for this project were of two types: (i) 1-in. × 3-in. (1 in. = 2.54 cm) glass microscope slides (standard glass microscope slides) and (ii) 1-in. × 3-in. indium tin oxide (ITO)-coated glass substrates. Microscope slides were selected because it is assumed that their surface will represent adhesion forces affecting particle attachment similar to the optics inside the GCC (typically based on an MLD coating having a SiO2 layer on its surface). The conductive ITO coating on the glass allows for particles to be imaged with a scanning electron microscope (SEM) without an additional conductive coating on top of the particles, ensuring that proper elemental identification can be performed with energy dispersive X-ray analysis (EDS). The ITO-coated substrates (Sigma-Aldrich® #636916) had a resistivity between 15 and 25 Ω. All collection substrates were precision cleaned before use. The cleaning process included a mechanical scrub followed by a final spray rinse with 18 MΩ deionized water[47]. After cleaning, the substrates were placed in cleaned containers to minimize particle collection during handling and transport. It must be noted that the collection substrates in this study were placed on horizontal surfaces, whereas the optical components are mounted vertically.
2.2 Analysis methods
Each collection substrate was imaged twice, first after cleaning and then after retrieval (at the end of the collection period) from inside the GCC. The images were captured by a Leica microscope using a 10× objective but limited additional higher resolution images were acquired using the 50× objective. The image of each collection substrate was acquired using commercial software that enabled automated scanning of its entire surface via image stitching of individual images of subsections (1215 images per substrate). Particle counting was performed on the individual images for each collection substrate and added to account for the entire substrate. The pre-exposure (to GCC operation) particle count, arising from pre-existing features, is subtracted from the post-exposure counts in each collection sample.
The image processing and particle counting was done with Image-Pro®. Each image had the bright background removed, then the particles in the images were counted and their perceived diameter was recorded. Measuring and counting of particles was done by thresholding the image; any pixel intensity value darker than the threshold was included in the analysis. The average diameter was measured for all the particles and only particles that had an average diameter of greater than or equal to 3 pixels were counted in this analysis to ensure pixel background variation was excluded in the analysis. This approach resulted in the smallest nominal detected particle being 1.36 μm in diameter for the 10× objective and 0.3 μm for the 50× objective. All images where the edge of the substrate was present were excluded from processing altogether because the edges tended have chips and other features that were not of interest. All of the counted particles and their measurements from each collection substrate were exported to a text file with the subsequent analysis of particle measurements performed with MATLAB® software.
Chemical composition identification was performed on a subset of the particles collected on ITO-coated substrates. Composition identification was performed with EDS using an EDAX® Octane Elect Super EDS system and a ZEISS Sigma 300 SEM. All of the EDS measurements and SEM images were collected using a 10-kV electron source. Spectra from point areas were first collected to determine the main elements and then a map of the particle via scanning was generated to examine its chemical topography.
3 Results
3.1 Particle concentration and statistics
The particle collection process discussed above was performed during five different quarterly operational periods of the GCC. The average particle densities on the uncoated collection substrates at the different locations for each operational period are shown in Figure 2. The results indicate significant variation in particle density between different collection periods, but generally the particle density tends to be lowest near the fourth tiled grating assemblies (UC G4 and LC G4) and highest at SPHR15, which is near the OMEGA EP target port. The second-highest particle density tends to be located at the second grating tile assembly in the UC (UC G2), which is closest to the chamber doors.
![]()
Figure 2.Particle density on the uncoated collection substrates measured with the 10× objective for each location inside the OMEGA EP GCC over the course of the study.
The analysis of the particle size distribution indicated that the majority of the particles have diameters that are less than or equal to 4 μm. Using the 10× objective for image acquisition, the size distribution of the particles (quantified by their perceived diameter) tends to be similar among the different locations, as seen in Figure 3(a). The majority of the particles have a diameter smaller than 3 μm. Larger particles are also observed, where particles in the range of 10–50 μm in diameter can be found with a density of the order of 0.1 mm–2 and particles larger than 50 μm in diameter have a density of the order of 0.01 mm–2. Using the 50× objective to more accurately assess the distribution of smaller particles, the results suggest that the peak of the particle size distribution can vary between 0.3 and 1.5 μm, as seen in Figure 3(b). Differences in the distribution histogram arise from the automated thresholding for detection of particles by the image analysis software.
![]()
Figure 3.Particle diameter distribution histogram for each location for the FY22 Q2 operational period with samples imaged with the (a) 10× objective and (b) 50× objective. The histogram bin size for both magnifications is 0.25 μm.
![]()
Figure 4.Scanning electron microscope (SEM) images of stainless-steel particles that were generated offline via mechanical shaving with a metal file. The particles have rough, distinct surfaces and edges.
3.2 Particle chemical composition
A subset of particles was analyzed for particle morphology and chemical composition using the SEM and EDS. The subsets of particles were taken from two different operational periods and were collected at the SPHR4 or SPHR15 (located near the beam-transfer tubes to target chambers) and the UC G2 location (located nearest to the entrance/exit door to the OMEGA EP GCC).
High-resolution SEM images of the particles may provide insight on possible particle-generation mechanisms. To obtain a baseline for comparison, stainless-steel particles were generated offline in a laboratory setting by two different means that represent (i) mechanical/fragmentation and (ii) laser-ablation–generation mechanisms. The first set of particles was generated by filing a stainless-steel sample with a new metal file, and is assumed to be representative of particles generated by mechanical damage. These resulting particles had a rough texture that included pitting or striations along the surface with sharp, uneven edges, as shown by the examples in Figure 4. The second set of offline-generated particles was collected following laser ablation of a stainless-steel substrate in ambient environment with 351-nm, 5-ns laser pulses. The ablated particles were collected on a substrate mounted next to the stainless steel being irradiated. These laser-ablation particles were typically small droplets, strands of melted metal or larger particles with a foam- or sponge-like texture and rounded edges, as demonstrated by the example presented in Figure 5. The sponge-like texture is highlighted in the inset image in Figure 5; it also tended to have higher oxygen signatures due to the larger surface area available for oxidization. The offline-generated laser-ablation particles are assumed to exhibit morphological similarities to particles that are produced from the ablation of the target and its surrounding materials or by stray beams impinging on the walls or components inside the GCC. The hypothesis is that comparison of the offline-generated particles with those observed at the GCC vacuum chamber can help elucidate the underlying mechanism governing their formation (laser ablation versus mechanical damage).
![]()
Figure 5.SEM images of stainless-steel particles that were generated offline via laser ablation with a 355-nm, 5-ns pulsed laser. Particles that were not droplets tended to have a foam-like texture, as shown in the inset.
The stainless-steel particles collected from the GCC (shown in Figure 6) had mostly rounded edges and smooth surfaces. The smooth, round nature of the particles more closely resembles the particles that were generated via laser ablation, suggesting that most particles are generated by laser heating or ablation. Similar observations and correlation were obtained for aluminum particles collected inside the GCC and compared with offline-generated aluminum particles.
![]()
Figure 6.SEM images of different stainless-steel particles collected in the GCC vacuum chamber.
The particle chemical composition performed using EDS has identified various elements that can be classified into three main categories: organics, inorganic containing metals and other inorganics. Table 1 summarizes the results obtained from two different quarterly periods and further separates them into common subcategories. The category termed ‘organics’ represents particles that express a strong carbon signature. The category termed ‘inorganic containing metals’ contains mostly metals but also metal oxides (such as a pure-Al signal or simultaneous detection of Al and O). Subcategories include the various and most commonly observed metals. All other inorganics (such as materials that have glass composition or semiconductors) are termed as ‘other inorganics’. The table also compares the chemical analysis results of the collection samples located near the same optic (UC G2) inside the GCC from these two periods.
| Types of particles identified | ||||
|---|---|---|---|---|
| Aluminum | 17.4% | 19.0% | 13.8% | 17.3% |
| Copper | 7.8% | 4.8% | 10.3% | |
| Gold | 1.8% | 3.7% | 2.3% | |
| Iron/SS | 17.4% | 1.1% | 21.8% | 2.0% |
| Other | 5.4% | 1.1% | 6.9% | |
| Fused silica | 4.8% | 7.9% | 5.7% | 8.2% |
Table 1. Composition distribution of particles characterized using energy dispersive X-ray analysis (EDS) for two operation periods, ‘FY21 Q4’ and ‘FY22 Q1’, and categorized as ‘total’, representing all identified particles found at different locations, and as ‘UC G2’, representing identified particles that were collected near the upper compressor G2.
![]()
Figure 7.SEM images of particles that are a conglomeration of smaller particles. (a1) SEM image of an aluminum particle with pieces of silicon attached on top. (a2) EDS map of elements for the particles in (a1). (b)–(e) Additional SEM image examples of particle conglomerations with elements identified.
The identified particles were typically found to be either organic or inorganic containing metal, with only about 15% found to be classified as other inorganics. Nearly half of the identified particles in the FY21 Q4 period contained metal, with aluminum and stainless-steel elements being the most common, while a third of the identified particles were identified as organic. In the subsequent period (FY22 Q1) over half of the identified particles were organic, while about 30% contained metal, with the primary metal being aluminum. The particle composition distribution for the single location is similar to the observed distributions (total) for the operational periods. A large majority of the identified particles were found to be single materials, but a portion of the particles identified were a conglomeration of smaller particles. The conglomeration of particles could be an indication of particle generation in a confined region, such as target disintegration during laser shots. Examples of conglomerated particles are shown in Figure 7. The smaller particles that conglomerated onto larger particles were typically metallic particles.
4 Discussion
Understanding and quantifying how contamination particles affect the damage performance of reflective optical components during their lifetime is of vital importance. The work presented in Ref. [25] provides valuable insight into the associated mechanisms. Specifically, the damage threshold of the pristine (uncontaminated) optic was compared to that in the presence of model contamination particles as well as the fluence of particle ejection, commonly referred to as laser cleaning. The particle-ejection fluence for 0.6 and 10-ps pulses in all cases was found to be significantly lower than that of the LIDT, having values within the operational fluence range of current laser systems, such as OMEGA EP. As a result, optics that contain such particle contamination will experience ‘laser cleaning’ (removal of these particles) under exposure to a subsequent laser pulse. Therefore, laser cleaning will make these optics appear free of contamination under visual inspection and particles may be observed only outside the beam footprint on the optics.
The problem becomes evident when comparing these laser-cleaning threshold values with the corresponding particle-induced substrate damage and secondary contamination threshold values, which are often much lower than those of the laser-cleaning threshold. This implies that the laser-cleaning process is not a ‘benign’ process, but rather is associated with some type of damage or other modification of the optic, depending on the particle type. The present work suggests that there may be a continuous contamination load reaching the optics during system operation. This will lead to contamination-induced damage on the optic that will continue to increase over time at a rate that will be directly proportional to the contamination load. Arguably, this can affect the damage performance of the optic over time because the integrity of the top (or even deeper) coating layers will be compromised, leading to a reduced damage threshold or (perhaps the more relevant) damage-growth threshold[48,49]. This ‘wearing’ effect will be cumulative with time and can be manifested as a reduction of the observed damage performance of the optics over time. This in turn can be addressed via lowering the operational fluence of the system during the lifetime of the optic at a rate that would be related to the contamination load.
The above discussion suggests that efforts to improve the damage performance of optical components must include management of contamination sources. It may be beneficial to reassess the design of the optical coatings aiming to minimize the effects of damage degradation due to particle contamination. For example, Qiu et al.[20,23] suggested the use of a protective layer. Furthermore, it is important to understand what particle sizes and types are potentially dangerous and will introduce damage. Particles having a diameter larger than the light’s wavelength will generate ‘hot spots’ of localized intensity many times that of the incident beam and can cause damage (depending on the pulse duration) on the optics at a fluence proportionally lower than that for a nominally pristine surface. Work by Huang et al.[27] showed that particle sizes as small as one-quarter of the laser wavelength can introduce a field enhancement that is higher than that inherent to the coating-design parameters that can proportionally reduce the damage threshold of the optic. OMEGA EP operates at a wavelength of 1053 nm and, based on the modeling results, metal particle sizes of the order of 250 nm could introduce EFI on the optic of the order of 2× (increasing to 4× for sizes of the order of 1 μm), while transparent particles could introduce EFI larger than approximately equal to 3× for particle sizes larger than 1 μm. This study suggests that the majority of particles observed were in the 250-nm to 3-μm range and could significantly affect the long-term damage performance of the optical components.
Management of the contamination in the operational environment of short-pulse laser systems, such as in the pulse compression sector, may be as important as producing higher damage-threshold optics. Such particles or the ensuing optic degradation would be very difficult to detect online. It may also be very difficult for system operators to determine whether damage on a specific optic is due to contamination (and the type) or the original optic quality and the rate by which different optical elements are affected. To address and control contamination issues, detailed chemical analysis of particles located on the optical elements outside the beam footprint (beam aperture) can be instructive. In addition, differential analysis may also be beneficial. For example, optical components closer to the tube connected to the target chamber and others close to the entrance door or venting ports may exhibit different amounts of contamination and/or types of contamination depending on their source. Understanding these behaviors may help one to determine the contamination sources, devise methods to reduce their effect and ultimately maintain the performance and lifetime of the optics.
The presence of multicomponent particles (see Figure 7) may be suggestive that particle conglomeration occurs in a confined space while particles are traveling in different directions and/or at different speeds. This will lead to particle collisions with adhesion being enhanced when particles are in the liquid (melted) phase. Furthermore, the fact that the particle composition distribution was found to vary between collection periods may be suggestive that the particle-generation source is outside the GCC. These observations may be supportive of the hypothesis that particles could have been generated during the target implosions and were able to travel back through the beam path from the target chamber into the GCC, where they eventually settled. Such particle transport can involve complex mechanisms (such as electrostatic and dielectrophoretic forces) or simply pressure gradients generated during the ablation of the target or during compression and decompression of subsystems (vacuum chambers, transport lines, etc.) for maintenance. Future work will focus on understanding the particle transport mechanisms.
5 Conclusion
This work investigated the characteristics of the particle load inside the GCC near critical optics. It considers that this particle load, which appears to be continuously generated during operation of the system, can introduce degradation of laser-induced damage performance and, therefore, negatively affects the optics’ lifetime. It was determined that there can be significant amounts of particles throughout the vacuum chamber. The mechanism and origin of particle generation will be the subject of future investigation along with methods to mitigate this problem. However, because the chemical composition of these particles varies between collection periods, the working hypothesis is that the majority of these particles originate from the two target chambers.
References
[1] N. Bloembergen. Appl. Opt., 12, 661(1973).
[2] A. A. Manenkov. Opt. Eng., 53, 010901(2014).
[3] C. J. Stolz, M. D. Feit, T. V. Pistor. Appl. Opt., 45, 1594(2006).
[4] X. Cheng, J. Zhang, T. Ding, Z. Wei, H. Li, Z. Wang. Light Sci. Appl., 2, e80(2013).
[5] I. A. Fersman, L. D. Khazov. Sov. J. Opt. Technol., 37, 627(1971).
[6] M. D. Feit, A. M. Rubenchik, D. R. Faux, R. A. Riddle, A. B. Shapiro, D. C. Eder, B. M. Penetrante, D. Milam, F. Y. Genin, M. R. Kozlowski. Proc. SPIE, 2966, 417(1997).
[7] F. Y. Génin, M. R. Kozlowski, R. Brusasco. Proc. SPIE, 3047, 978(1997).
[8] F. Y. Génin, K. Michlitsch, J. Furr, M. R. Kozlowski, P. A. Krulevitch. Proc. SPIE, 2966, 126(1997).
[9] D. M. Kane, D. R. Halfpenny. J. Appl. Phys., 87, 4548(2000).
[10] F. Y. Génin, M. D. Feit, M. R. Kozlowski, A. M. Rubenchik, A. Salleo, J. Yoshiyama. Appl. Opt., 39, 3654(2000).
[11] J. Honig, M. A. Norton, W. G. Hollingsworth, E. E. Donohue, M. A. Johnson. Proc. SPIE, 5647, 129(2005).
[12] M. A. Norton, C. J. Stolz, E. E. Donohue, W. G. Hollingsworth, K. Listiyo, J. A. Pryatel, R. P. Hackel. Proc. SPIE, 5991, 59910O(2006).
[13] S. Palmier, J. L. Rullier, J. Capoulade, J.-Y. Natoli. Appl. Opt., 47, 1164(2008).
[14] S. Palmier, S. Garcia, J.-L. Rullier. Opt. Eng., 47, 084203(2008).
[15] Y. Ye, X. Yuan, X. Xiang, X. Cheng, X. Miao. Optik, 123, 1056(2012).
[16] T. Jitsuno, H. Murakami, K. Kato, E. Sato, K. Mikami, S. Motokoshi, N. Miyanaga, H. Azechi. Proc. SPIE, 8786, 87860B(2013).
[17] K. E. Gushwa, C. I. Torrie. Proc. SPIE, 9237, 923702(2014).
[18] R. N. Raman, S. G. Demos, N. Shen, E. Feigenbaum, R. A. Negres, S. Elhadj, A. M. Rubenchik, M. J. Matthews. Opt. Express, 24, 2634(2016).
[19] M. J. Matthews, N. Shen, J. Honig, J. D. Bude, A. M. Rubenchik. J. Opt. Soc. Am. B, 30, 3233(2013).
[20] S. R. Qiu, M. A. Norton, R. N. Raman, A. M. Rubenchik, C. D. Boley, A. Rigatti, P. B. Mirkarimi, C. J. Stolz, M. J. Matthews. Appl. Opt., 54, 8607(2015).
[21] C. D. Harris, N. Shen, A. M. Rubenchik, S. G. Demos, M. J. Matthews. Opt. Lett., 40, 5212(2015).
[22] S. G. Demos, R. A. Negres, R. N. Raman, N. Shen, A. M. Rubenchik, M. J. Matthews. Opt. Express, 24, 7792(2016).
[23] S. R. Qiu, M. A. Norton, J. Honig, A. M. Rubenchik, C. D. Boley, A. Rigatti, C. J. Stolz, M. J. Matthews. Opt. Eng., 56, 011108(2016).
[24] S. G. Demos, J. C. Lambropoulos, R. A. Negres, M. J. Matthews, S. R. Qiu. Opt. Express, 27, 23515(2019).
[25] K. R. P. Kafka, S. G. Demos. Opt. Lett., 44, 1844(2019).
[26] K. R. P. Kafka, B. N. Hoffman, H. Huang, S. G. Demos. Opt. Eng., 60, 031009(2020).
[27] H. Huang, K. R. P. Kafka, S. G. Demos. Opt. Express, 29, 27031(2021).
[28] H. Wang, H. Qi, J. Zhao, B. Wang, Y. Chai, Z. Yu, J. Shao. Appl. Phys. Lett., 108, 141603(2016).
[29] X. Ling, S. Liu, X. Liu. Phys. Scr., 94, 125707(2019).
[30] J. Perrière, C. Boulmer-Leborgne, R. Benzerga, S. Tricot. J. Phys. D, 40, 7069(2007).
[31] B. R. Tull, J. E. Carey, M. A. Sheehy, C. Friend, E. Mazur. Appl. Phys. A, 83, 341(2006).
[32] B. Tan, K. Venkatakrishnan. Opt. Express, 17, 1064(2006).
[33] S. G. Demos, R. A. Negres, R. N. Raman, M. D. Feit, K. R. Manes, A. M. Rubenchik. Optica, 2, 765(2015).
[34] S. G. Demos, R. A. Negres. Opt. Eng., 56, 011016(2016).
[35] C. W. Carr, J. Bude, P. E. Miller, T. Parham, P. Whitman, M. Monticelli, R. Raman, D. Cross, B. Welday, F. Ravizza, T. Suratwala, J. Davis, M. Fischer, R. Hawley, H. Lee, M. Matthews, M. Norton, M. Nostrand, D. Vanblarcom, S. Sommer. Proc. SPIE, 10447, 1044702(2017).
[36] D. Ensor, R. Donovan, B. Locke. J. Environ. Sci., 30, 44(2006).
[37] W. Whyte, K. Agricola, M. Derks. Clean Air Contain. Rev., 25, 4(2016).
[38] International Organization for Standardization, “ISO 14644-1:2015 Cleanrooms and associated controlled environments –Part 1: Classification of air cleanliness by particle concentration,” ().(2015).
[39] W. J. Siekhaus, J. H. Kinney, D. Milam, L. L. Chase. Appl. Phys. A, 39, 163(1986).
[40] J. T. Dickinson, S. C. Langford, J. J. Shin, D. L. Doering. Phys. Rev. Lett., 73, 2630(1994).
[41] G. C. Tyrrell, T. H. York, L. G. Coccia, I. W. Boyd. Appl. Surf. Sci., 769(1996).
[42] S. G. Demos, C. W. Carr, D. A. Cross. Opt. Lett., 42, 2643(2017).
[43] J. Andrew, R. H. Burrell, C. W. Jones, A. E. Leatherland, A. D. Sibley. Proc. SPIE, 10447, 1044703(2017).
[44] A. A. Kozlov, S. G. Demos, D. Canning, B. N. Hoffman, B. E. Kruschwitz, A. L. Rigatti, N. Savidis, L. J. Waxer. Opt. Eng., 60, 031008(2021).
[45] J. H. Kelly, L. J. Waxer, V. Bagnoud, I. A. Begishev, J. Bromage, B. E. Kruschwitz, T. J. Kessler, S. J. Loucks, D. N. Maywar, R. L. McCrory, D. D. Meyerhofer, S. F. B. Morse, J. B. Oliver, A. L. Rigatti, A. W. Schmid, C. Stoeckl, S. Dalton, L. Folnsbee, M. J. Guardalben, R. Jungquist, J. Puth, M. J. Shoup, D. Weiner, J. D. Zuegel. J. Phys. IV France, 133, 75(2006).
[46] J. Qiao, A. Kalb, T. Nguyen, J. Bunkenburg, D. Canning, J. H. Kelly. Opt. Lett., 33, 1684(2008).
[47] A. L. Rigatti. Proc. SPIE, 5647, 136(2005).
[48] M. Sozet, S. Bouillet, J. Berthelot, J. Neauport, L. Lamaignère, L. Gallais. Opt. Express, 25, 25767(2017).
[49] M. Sozet, J. Neauport, E. Lavastre, N. Roquin, L. Gallais, L. Lamaignère. Opt. Lett., 41, 2342(2016).


Set citation alerts for the article
Please enter your email address

© Copyright 2018-2021 | Chinese Laser Press. All Rights Reserved 沪ICP备15018463号-20