Wulong BA1,1,1,1,1,1, Pengfei DU1,1,1,1,1,1,*, Tie LIU1,1,1, Anming BAO1,1,1..., Xi CHEN1,1,1, Jiao LIU1,1,1 and Chengxin QIN1,1,1|Show fewer author(s)
Author Affiliations
11State Key Laboratory of Environmental Simulation and Pollution Control, School of Environment, Tsinghua University, Beijing 100084, China12State Key Laboratory of Desert and Oasis Ecology, Xinjiang Institute of Ecology and Geography, CAS, Urumqi 830011, China13School of Energy and Power Engineering, Xihua University, Chengdu 610039, Chinashow less
DOI: 10.1007/s11442-020-1721-z
Cite this Article
Wulong BA, Pengfei DU, Tie LIU, Anming BAO, Xi CHEN, Jiao LIU, Chengxin QIN. Impacts of climate change and agricultural activities on water quality in the Lower Kaidu River Basin, China[J]. Journal of Geographical Sciences, 2020, 30(1): 164
Copy Citation Text
show less
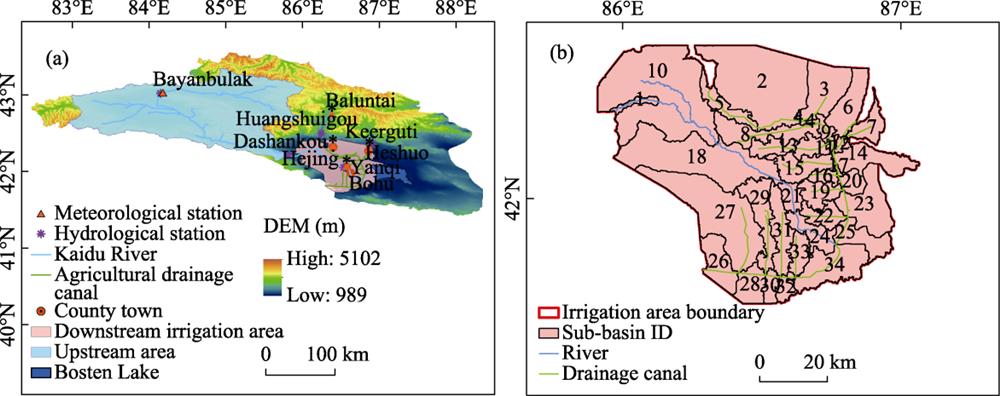
Fig. 1. Locations of the Kaidu River Basin (a) and irrigation area of the lower reaches of the Kaidu River Basin (b)
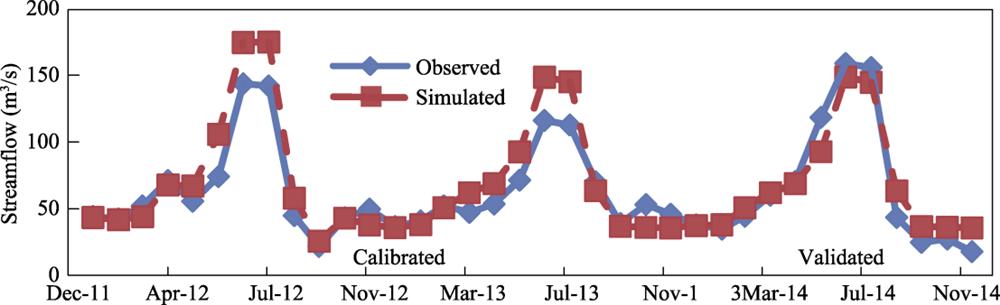
Fig. 2. Calibration and validation of monthly streamflow at the Yanqi hydrological station (2012-2014)
Fig. 3. Simulated and observed values of streamflow in the calibration (a) and validation periods (b) (2012-2014)
Fig. 4. Simulated and observed values of TN and TP in the calibration (a) and validation periods (b) (2012-2014)
Fig. 5. Distributions of annual average total nitrogen (TN) (a) and total phosphorus (TP) (b) (2010-2014)
Fig. 6. Drainage map of Kaidu River irrigation area
| Climate scenarios | Temperature change (℃) | Precipitation change (%) | Streamflow change (%) |
|---|
| A | +0.5 | -10 | -10 | | B | +0.7 | +10 | +10 | | C | +1.3 | +20 | -10 | | D | +1.9 | +30 | -20 | | Management scenarios | Measures | | E | Agricultural irrigation efficiency increased from 58 % to 75% | | F | Amount of fertilizer application reduced by 20% |
|
Table 1. Climate change (2040-2044) and agricultural management measure scenarios used in this study
| Parameter | Definition | Ranges | Fitted value |
|---|
| LAT_TTIME | Lateral flow travel time | 0.00-180.00 | 62.00 | | NPERCO | Nitrogen percolation coefficient | 0.00-1.00 | 0.21 | | ALPHA_BF | Baseflow alpha factor | 0.00-1.00 | 0.25 | | GW_REVAP | Groundwater evaporation coefficient | 0.02-0.20 | 0.02 | | GW_DELAY | Groundwater delay | 0.00-500.00 | 14.00 | | ESCO | Soil evaporation compensation factor | 0.00-1.00 | 0.19 | | BIOMIX | Biological mixing efficiency | 0.00-1.00 | 0.26 | | USLE_P | USLE equation support practice | 0.00-1.00 | 0.26 | | BC1 | Rate constant for biological oxidation of NH3 | 0.10-1.00 | 0.55 | | BC2 | Rate constant for biological oxidation NO2 to NO3 | 0.20-2.00 | 1.10 |
|
Table 2. Parameters used for calibration of the SWAT model (2012-2013)
| Variable | Period | R2 | NSE | PBIAS (%) |
|---|
| Streamflow | Calibration (2012/01-2013/12) | 0.84 | 0.80 | -28.57 | | Validation (2014/01-2014/12) | 0.86 | 0.83 | 7.46 | | TN (t) | Calibration (2012/01-2013/12) | 0.85 | 0.79 | -27.32 | | Validation (2014/01-2014/12) | 0.86 | 0.82 | 10.68 | | TP (t) | Calibration (2012/01-2013/12) | 0.79 | 0.75 | -35.34 | | Validation (2014/01-2014/12) | 0.81 | 0.73 | 12.35 |
|
Table 3. Calibration and validation results of model parameters
| Sub-basin ID | Receiving water | Drainage canal | TN (t) | TP (t) | Discharge (104 m3/s) |
|---|
| 24 | BigLakeDistrict | Kaidu River | 2345.36 | 9.50 | 225896.46 | | 16 | Halayin, Dongdahan | 4.16 | 0.24 | 723.98 | | 19 | Benbutu, 25th Regiment | 9.52 | 0.60 | 1539.51 | | 22 | Bohu Town, Wulan Town | 10.29 | 0.64 | 1485.38 | | 7 | Bortu, 26th Regiment West | 6.26 | 0.66 | 1545.33 | | 2 | YellowWaterDistrict | Huangshui River | 499.58 | 2.70 | 12633.36 | | 8 | 22nd Regiment North and South | 36.69 | 1.21 | 2624.37 | | 13 | Shengli, Beigan | 26.85 | 0.99 | 2331.01 | | 15 | Dongfeng | 24.11 | 0.81 | 1685.94 | | 3 | 6th and 4th Companies of the 24th Regiment | 16.6 | 0.01 | 101.94 | | 6 | Qingshui River West and East | 22.64 | 1.85 | 1516.93 | | 27 | SmallLakeDistrict | Tuanjie | 61.52 | 3.28 | 10091.55 | | 29 | Jiefang, 40 Lichengzi | 22.58 | 1.03 | 2461.36 | | 31 | 27th Regiment, Yongning Town | 23.03 | 0.96 | 2091.49 | | 33 | Yongning Town East, Chaganur | 9.91 | 0.51 | 1268.55 | | Total | 3119.10 | 24.99 | 267997.16 |
|
Table 4. Average annual non-point source (NPS) pollutant emissions and streamflow discharge for each drainage canal (2010-2014)
| Scenarios | Water source | Precipitation (mm) | Discharge (m3/s) | TN (t) | TP (t) |
|---|
| Reference period | Drainage | 79.51 | 4.21×10⁸ | 773.73 | 15.47 | | River | 246.47 | 2.26×10⁹ | 2345.36 | 9.50 | | Scenario A | Drainage | 71.56 | 4.03×10⁸ | 704.39 | 13.60 | | River | 221.82 | 1.93×10⁹ | 2233.16 | 9.12 | | Scenario B | Drainage | 87.46 | 4.37×10⁸ | 845.33 | 21.88 | | River | 271.12 | 2.58×10⁹ | 2485.97 | 15.21 | | Scenario C | Drainage | 95.41 | 4.09×10⁸ | 847.70 | 20.98 | | River | 295.76 | 1.94×10⁹ | 2331.32 | 13.70 | | Scenario D | Drainage | 103.36 | 3.84×10⁸ | 854.98 | 20.20 | | River | 320.41 | 1.61×10⁹ | 2222.45 | 12.87 | | Scenario E | Drainage | 79.51 | 4.41×10⁸ | 773.73 | 15.47 | | River | 246.47 | 2.26×10⁹ | 2345.36 | 9.50 | | Scenario F | Drainage | 79.51 | 4.21×10⁸ | 661.56 | 12.99 | | River | 246.47 | 2.26×10⁹ | 2312.59 | 8.93 |
|
Table 5. Changes of NPS pollution in the Kaidu River and drainage canals under different scenarios