
Wulong BA, Pengfei DU, Tie LIU, Anming BAO, Xi CHEN, Jiao LIU, Chengxin QIN. Impacts of climate change and agricultural activities on water quality in the Lower Kaidu River Basin, China[J]. Journal of Geographical Sciences, 2020, 30(1): 164
- Journal of Geographical Sciences
- Vol. 30, Issue 1, 164 (2020)
Abstract
1 Introduction
The arid region of northwest China is located in the hinterland of Euroasian continent where the geographic conditions are can be characterized by inland river basins and alpine forests. The regions experience high levels of precipitation and water vapor due to the high mountains, and the mountains provide water resources for the downstream oases (
Due to the complexity of the water environment, current research has mainly focused on the individual effects of climate change or human activities on water resources (
The Kaidu River is a typical inland river originated from the Sarming Mountain of the Tianshan Mountains in Xinjiang, northwest China. Bosten Lake, at the tail of the Kaidu River, is the largest interior freshwater lake in China. In the past 50 years, four counties around the lake have diverted water from the Kaidu River to develop agriculture and industry (
Given the lack of a systematic analysis, we used the SWAT model to simulate the NPS pollution of the irrigation area in the lower reaches of the Kaidu River Basin. First, we calibrated and validated the SWAT model and simulated the distributions of nitrogen and phosphorus pollutants in the study area. Second, we identified the water environmental pollution, and finally, we separately predicted the NPS pollution load of inlet water of the Kaidu River and farmland sewage by using four climate change scenarios and two management measure scenarios. The simulations and predictions of NPS pollution can provide technical support for water environmental protection and treatment in the lower reaches of the Kaidu River.
2 Materials and methods
2.1 Study area
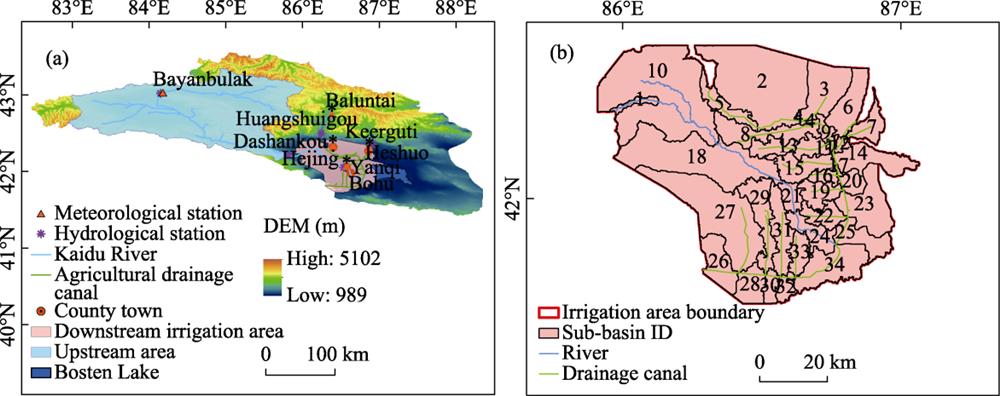
The Kaidu River Basin is located in Xinjiang Uygur Autonomous Region, China and lies in the southern Tianshan Mountains covering an area of 43,890 km2 (
![]()
Figure 1.
2.2 Model and input data
Establishing a hydrological model is the most effective way to quantitatively simulate the NPS pollution. The SWAT model was developed by the US Department of Agriculture to simulate the transportation of runoff, sediment, and nutrients in ungauged watersheds, and has also been widely used for NPS pollution calculations at different scales (
The digital elevation model (DEM) data with a resolution of 90 m was obtained by Shuttle Radar Topography Mission (SRTM). Land use data at a scale of 1:100,000 were provided by the Xinjiang Institute of Ecology and Geography, Chinese Academy of Sciences (CAS). Soil map data at a scale of 1:1,000,000 were provided by the Harmonized World Soil Database (HWSD). Daily meteorological data from 2009 to 2014 at Bayanbulak, Baluntai and Yanqi meteorological stations were downloaded from the China Meteorological Science Data Sharing Service (http://cdc.cma.gov.cn/home.do). Daily runoff data from 2009 to 2014 for Dashankou, Yanqi, Huangshuigou, and Keerguti hydrological stations were obtained from the Xinjiang Hydrographic Bureau. Monthly water-quality monitoring data for 2009 through 2014 for the Yanqi hydrological station were provided by the Environmental Monitoring Station of Bayingolin, Xinjiang.
The water quality monitoring parameters used in this study were total nitrogen (TN) and total phosphorus (TP). The analytical methods for TN and TP were potassium persulfate oxidative ultraviolet spectrophotometry and ammonium molybdate spectrophotometry, respectively. Fertilization data for 2010 through 2014 were obtained from the Bayingolin Statistical Yearbook.
After constructing a basic database of the hydrological model, the SWAT completed a spatial dispersion of the basin by dividing it into several sub-basins. The river network and drainage canals were embedded in the SWAT model. We identified and generalized 25 major drainage canals in the study area, and outlined 15 vectorized agricultural drainage canals. Based on the overlay analysis of land use maps, soil type maps and slope maps, we divided the irrigation area in the lower reaches of the Kaidu River Basin into 34 sub-basins (
2.3 Climate change and management scenarios
The irrigation area in the lower reaches of the Kaidu River Basin is characterized by an arid climate, with the average annual precipitation of about 60 mm and the average annual evaporation of more than 2000 mm (
In our previous study, we used the climate modeling outputs of three dynamic downscaling models (i.e., HadGEM3-RA, RegCM4, and SUN-MM5) and a set of statistical downscaling models under two greenhouse gas emission scenarios to simulate the future precipitation change and streamflow of the Kaidu River Basin (
| Climate scenarios | Temperature change (℃) | Precipitation change (%) | Streamflow change (%) |
|---|---|---|---|
| A | +0.5 | -10 | -10 |
| B | +0.7 | +10 | +10 |
| C | +1.3 | +20 | -10 |
| D | +1.9 | +30 | -20 |
| Management scenarios | Measures | ||
| E | Agricultural irrigation efficiency increased from 58 % to 75% | ||
| F | Amount of fertilizer application reduced by 20% | ||
Table 1.
Climate change (2040-2044) and agricultural management measure scenarios used in this study
It has been previously studied that at the farm level, replacing furrows with drip irrigation can increase water use efficiency by 50%-90% (
2.4 Evaluation criteria
In order to accurately simulate the hydrological processes and NPS pollution of the irrigation area in the lower reaches of the Kaidu River Basin, we calibrated and validated the SWAT model firstly using monthly flow data from 2011 through 2014. Moreover, the water quality simulation parameters were calibrated using water quality monitoring data during 2009-2014 at the Yanqi hydrological station.
In this study, the performance of the SWAT model was evaluated on the basis of the Nash efficiency coefficient (NSE) (
3 Results
3.1 Model calibration
A Sequential Uncertainty Fitting ver.2 (SUFI-2) method was used for parameter sensitivity analysis of the SWAT model (
| Parameter | Definition | Ranges | Fitted value |
|---|---|---|---|
| LAT_TTIME | Lateral flow travel time | 0.00-180.00 | 62.00 |
| NPERCO | Nitrogen percolation coefficient | 0.00-1.00 | 0.21 |
| ALPHA_BF | Baseflow alpha factor | 0.00-1.00 | 0.25 |
| GW_REVAP | Groundwater evaporation coefficient | 0.02-0.20 | 0.02 |
| GW_DELAY | Groundwater delay | 0.00-500.00 | 14.00 |
| ESCO | Soil evaporation compensation factor | 0.00-1.00 | 0.19 |
| BIOMIX | Biological mixing efficiency | 0.00-1.00 | 0.26 |
| USLE_P | USLE equation support practice | 0.00-1.00 | 0.26 |
| BC1 | Rate constant for biological oxidation of NH3 | 0.10-1.00 | 0.55 |
| BC2 | Rate constant for biological oxidation NO2 to NO3 | 0.20-2.00 | 1.10 |
Table 2.
Parameters used for calibration of the SWAT model (2012-2013)
The observed and simulated time series of streamflow are shown in
| Variable | Period | NSE | PBIAS (%) | |
|---|---|---|---|---|
| Streamflow | Calibration (2012/01-2013/12) | 0.84 | 0.80 | -28.57 |
| Validation (2014/01-2014/12) | 0.86 | 0.83 | 7.46 | |
| TN (t) | Calibration (2012/01-2013/12) | 0.85 | 0.79 | -27.32 |
| Validation (2014/01-2014/12) | 0.86 | 0.82 | 10.68 | |
| TP (t) | Calibration (2012/01-2013/12) | 0.79 | 0.75 | -35.34 |
| Validation (2014/01-2014/12) | 0.81 | 0.73 | 12.35 |
Table 3.
Calibration and validation results of model parameters
![]()
Figure 2.
![]()
Figure 3.
![]()
Figure 4.
3.2 Distribution of NPS pollutant load in Lower Kaidu River Basin
In this study, the SWAT model was used to simulate typical pollution loads such as nitrogen and phosphorus of the irrigation area of the lower reaches of the Kaidu River Basin. Specifically, the spatial distribution of annual average NPS pollution loads in the study area during 2010-2014 was analyzed, and the spatial distribution of nitrogen and phosphorus loads was plotted (
![]()
Figure 5.
3.3 Contributions of all sub-basins to NPS pollution in Lower Kaidu River Basin
| Sub-basin ID | Receiving water | Drainage canal | TN (t) | TP (t) | Discharge (104 m3/s) |
|---|---|---|---|---|---|
| 24 | Big | Kaidu River | 2345.36 | 9.50 | 225896.46 |
| 16 | Halayin, Dongdahan | 4.16 | 0.24 | 723.98 | |
| 19 | Benbutu, 25th Regiment | 9.52 | 0.60 | 1539.51 | |
| 22 | Bohu Town, Wulan Town | 10.29 | 0.64 | 1485.38 | |
| 7 | Bortu, 26th Regiment West | 6.26 | 0.66 | 1545.33 | |
| 2 | Yellow | Huangshui River | 499.58 | 2.70 | 12633.36 |
| 8 | 22nd Regiment North and South | 36.69 | 1.21 | 2624.37 | |
| 13 | Shengli, Beigan | 26.85 | 0.99 | 2331.01 | |
| 15 | Dongfeng | 24.11 | 0.81 | 1685.94 | |
| 3 | 6th and 4th Companies of | 16.6 | 0.01 | 101.94 | |
| 6 | Qingshui River West and East | 22.64 | 1.85 | 1516.93 | |
| 27 | Small | Tuanjie | 61.52 | 3.28 | 10091.55 |
| 29 | Jiefang, 40 Lichengzi | 22.58 | 1.03 | 2461.36 | |
| 31 | 27th Regiment, Yongning Town | 23.03 | 0.96 | 2091.49 | |
| 33 | Yongning Town East, Chaganur | 9.91 | 0.51 | 1268.55 | |
| Total | 3119.10 | 24.99 | 267997.16 | ||
Table 4.
Average annual non-point source (NPS) pollutant emissions and streamflow discharge for each drainage canal (2010-2014)
The TN and TP discharged into the Yellow Water District accounted for 80.97% and 48.87% of the total pollutants in agricultural sewage, respectively. These data indicated that the Yellow Water District is the region most affected by NPS pollution in Bosten Lake. The TN and TP pollutants discharged into the Small Lake District were larger than those discharged into the Big Lake District, which accounted for 15.13% and 37.31% of the total pollution load, respectively.
![]()
Figure 6.
3.4 Response of NPS pollution under different scenarios
By inputting six scenarios related to climate change and agricultural management measures into the SWAT model, we obtained response results of the streamflow and NPS pollutants of the Kaidu River and drainage canals under different scenarios. The amount of agricultural sewage is closely related to the change of streamflow to the Kaidu River (
| Scenarios | Water source | Precipitation (mm) | Discharge (m3/s) | TN (t) | TP (t) |
|---|---|---|---|---|---|
| Reference period | Drainage | 79.51 | 4.21×10⁸ | 773.73 | 15.47 |
| River | 246.47 | 2.26×10⁹ | 2345.36 | 9.50 | |
| Scenario A | Drainage | 71.56 | 4.03×10⁸ | 704.39 | 13.60 |
| River | 221.82 | 1.93×10⁹ | 2233.16 | 9.12 | |
| Scenario B | Drainage | 87.46 | 4.37×10⁸ | 845.33 | 21.88 |
| River | 271.12 | 2.58×10⁹ | 2485.97 | 15.21 | |
| Scenario C | Drainage | 95.41 | 4.09×10⁸ | 847.70 | 20.98 |
| River | 295.76 | 1.94×10⁹ | 2331.32 | 13.70 | |
| Scenario D | Drainage | 103.36 | 3.84×10⁸ | 854.98 | 20.20 |
| River | 320.41 | 1.61×10⁹ | 2222.45 | 12.87 | |
| Scenario E | Drainage | 79.51 | 4.41×10⁸ | 773.73 | 15.47 |
| River | 246.47 | 2.26×10⁹ | 2345.36 | 9.50 | |
| Scenario F | Drainage | 79.51 | 4.21×10⁸ | 661.56 | 12.99 |
| River | 246.47 | 2.26×10⁹ | 2312.59 | 8.93 |
Table 5.
Changes of NPS pollution in the Kaidu River and drainage canals under different scenarios
4 Discussion
Although this study does not calibrate the variables of components TN and TP in the water quality parameters, the SWAT model simulates the trends of TN and TP under different climate change and agricultural management scenarios, and the simulation results can be used as a reference. The trends of TN and TP under different climate change scenarios indicate that, due to the use of chemical fertilizers and pesticides in the irrigation area in the lower reaches of the Kaidu River Basin, the contents of nitrate-nitrogen, organic nitrogen and mineral phosphorus in the surface soil are higher than those of other soil layers. This makes the contaminants susceptible to precipitation. In addition, the interception of nutrients by the roots of arable land is relatively weak, and soil erosion is more likely to occur, resulting in the loss of nitrogen and phosphorus. By reducing the fertilizer application by 20%, we found that the TN and TP in agricultural drainage canals were significantly reduced, and the largest reduction components were nitrate-nitrogen and mineral phosphorus, with the contributions of 16.55% and 16.36%, respectively.
In the past 70 years, the amount of agricultural water diversion on both sides of the Kaidu River has increased each year, decreasing both the amount of water entering Bosten Lake and the water level of the lake. Due to the decline in freshwater entering the lake and the increase of farmland drainage into the lake, the salinity of the lake has increased and the water quality in some areas has reached eutrophication. The simulation results under the climate change scenarios indicate that the water environment of the Kaidu River Basin will face more severe challenges, but that by implementing a reasonable strategy for managing industrial and agricultural wastewater, the situation can be improved.
The lack of daily water quantity and quality data in the agricultural drainage did limit this study somewhat. However, the SWAT model performs well in streamflow simulations. In addition, we only considered climate change in our future scenarios. We did not consider the impact of land use changes on NPS pollution. Different land use types contribute differently to non-point source pollution loads, thus, we recommend follow-up studies take into account a scenario in which land use changes.
5 Conclusions
This study used the SWAT model to analyze the NPS pollution in a typical arid basin. The spatial distribution of NPS pollution in the Yanqi Basin was obtained. Considering changes in water supply and precipitation intensity under several different future climate change conditions, the contribution of NPS pollutants to the Kaidu River and drainage canals was calculated and different future scenarios developed. Our primary findings were as follows:
(1) The loss of nitrogen and phosphorus nutrients in the study area had a certain degree of spatial heterogeneity. The nitrogen and phosphorus loads in the irrigation areas around the lake were relatively high, as they were affected by topographic factors and were in a high-risk area for agricultural NPS pollution.
(2) From 2010 through 2014, the average annual amount of TN and TP entering the Bosten Lake through the drainage canal accounted for 24.81% and 61.98% of the total lake input, reaching 773.74 t and 15.49 t respectively. This indicates that NPS pollution in agriculture is an important source of pollutants entering the lake.
(3) There are significant differences in the trends of changes in TN and TP in the Kaidu River and drainage canals under different climate scenarios. In the future, the water supply in the Kaidu River may decrease, while the nutrient load in the drainage canals could increase. This may lead to a deterioration of water quality of the Bosten Lake in the future, and the management of water environment could face severe challenges.
(4) Simulation results of management measures showed that after improving the water use efficiency, the streamflow of drainage canals will be increased by 4.77%. The TN and TP in the drainage canals will decrease after the fertilizer application is reduced by 20%, with the reductions of 14.49% and 16.03%, respectively.
References
[1] C Abbaspour K, A Johnson C, V Genuchten M T. Estimating uncertain flow and transport parameters using a sequential uncertainty fitting procedure. Vadose Zone Journal, 3, 1340-1352(2004).
[2] S Akhavan, J Abedi-Koupai, F Mousavi S et al. Application of SWAT model to investigate nitrate leaching in Hamadan-Bahar Watershed, Iran. Agriculture Ecosystems & Environment, 139, 675-688(2010).
[3] F Alcon, D Miguel M D, M Burton. Duration analysis of adoption of drip irrigation technology in southeastern Spain. Technological Forecasting & Social Change, 78, 991-1001(2011).
[4] M Al-Mukhtar, V Dunger, B Merkel. Assessing the impacts of climate change on hydrology of the upper reach of the Spree River: Germany. Water Resources Management, 28, 2731-2749(2014).
[5] L Ba W, F Du P, T Liu et al. Simulating hydrological responses to climate change using dynamic and statistical downscaling methods: A case study in the Kaidu River Basin, Xinjiang, China. Journal of Arid Land, 10, 905-920(2018).
[6] A Basher M, T Liu, A Kabir M et al. Climate change impact on the hydrological extremes in the Kaidu River Basin, China. Journal of Flood Engineering, 1, 93-108(2010).
[7] F Bouraoui, B Grizzetti. Modelling mitigation options to reduce diffuse nitrogen water pollution from agriculture. Science of the Total Environment, 468, 1267-1277(2014).
[8] H Chamchati, M Bahir. Contributions of climate change on water resources in semi-arid areas: Example of the Essaouira Basin (Morocco). Geographia Technica, 1, 1-8(2011).
[9] C Chen C, N Chen Y, H Yang Y et al. Hydrology and water resources variation and its response to regional climate change in Xinjiang. Journal of Geographical Sciences, 20, 599-612(2010).
[10] J Chen J. Analysis of water environment in the Xinjiang arid region. Arid Environmental Monitoring, 16, 223-224(2002).
[11] N Chen Y, Q Yang, Y Luo et al. Ponder on the issues of water resources in the arid region of northwest China. Arid Land Geography, 35, 1-9(2012).
[12] F Dechmi, A Skhiri. Evaluation of best management practices under intensive irrigation using SWAT model. Agricultural Water Management, 123, 55-64(2013).
[13] B Dibike Y, P Coulibaly. Hydrologic impact of climate change in the Saguenay watershed: Comparison of downscaling methods and hydrologic models. Journal of Hydrology, 307, 145-163(2005).
[14] V Griensven A, P Ndomba, S Yalew et al. Critical review of the application of SWAT in the upper Nile Basin countries. Hydrology & Earth System Sciences Discussions, 9, 3761-3788(2012).
[15] M Guo, X Zhou, J Li et al. Assessment of the salinization processes in the largest inland freshwater lake of China. Stochastic Environmental Research & Risk Assessment, 29, 1823-1833(2015).
[16] V Gupta H, S Sorooshian, O Yapo P. Status of automatic calibration for hydrologic models: Comparison with multilevel expert calibration. Journal of Hydrologic Engineering, 4, 135-143(1999).
[17] P Kaini, W Nicklow J. Optimizing structural best management practices using SWAT and genetic algorithm to improve water quality goals. Water Resources Management, 26, 1827-1845(2012).
[18] X Lei, J Lu, Z Liu et al. Concentration and distribution of antibiotics in water-sediment system of Bosten Lake, Xinjiang. Environmental Science & Pollution Research International, 22, 1670-1678(2015).
[19] T Liu, P Willems, L Pan X et al. Climate change impact on water resource extremes in a headwater region of the Tarim Basin in China. Hydrology and Earth System Sciences, 15, 3511-3527(2011).
[20] Y Liu, S Mu, A Bao et al. Effects of salinity and (an)ions on arsenic behavior in sediment of Bosten Lake, Northwest China. Environmental Earth Sciences, 73, 4707-4716(2015).
[21] D Mihon, V Bacu, D Rodila et al. Grid based hydrologic model calibration and execution. In: Dumitrache L (eds.). Advances in Intelligent Control Systems and Computer Science, 279-293(2013).
[22] N Moriasi D, G Arnold J, V Liew M W et al. Model evaluation guidelines for systematic quantification of accuracy in watershed simulations. Transactions of the ASABE, 50, 885-900(2007).
[23] N Moriasi D, H Gowda P, G Arnold J et al. Modeling the impact of nitrogen fertilizer application and tile drain configuration on nitrate leaching using SWAT. Agricultural Water Management, 130, 36-43(2013).
[24] G Mostofa K M, W Li, F Wu et al. Environmental characteristics and changes of sediment pore water dissolved organic matter in four Chinese lakes. Environmental Science & Pollution Research, 25, 1-22(2017).
[25] L Neitsch S, G Arnold J, R Kiniry J et al. Soil and water assessment tool theoretical documentation version 2009, Texas water resources institute, technical report No. 406. Texas:. Texas A&M University System College Station.(2011).
[26] N Pongpetch, P Suwanwaree, C Yossapol et al. Using SWAT to assess the critical areas and nonpoint source pollution reduction best management practices in Lam Takong River Basin, Thailand. Environmentasia, 8, 41-52(2015).
[27] Y Rusuli, L Li, S Ahmad et al. Dynamics model to simulate water and salt balance of Bosten Lake in Xinjiang, China. Environmental Earth Sciences, 74, 2499-2510(2015).
[28] B Shen B, L Wu J, H Zhao Z. Organochlorine pesticides and polycyclic aromatic hydrocarbons in water and sediment of the Bosten Lake, Northwest China. Journal of Arid Land, 9, 287-298(2017).
[29] G Wang. The utilization of water resource and its influence on eco-environment in the northwest arid area of china. Journal of Natural Resources, 43, 121-131(1999).
[30] X Wang S, B Wu, N Yang P et al. Determination of the ecological groundwater depth considering ecological integrity over oasis irrigation areas in the Yanqi Basin. Resources Science, 33, 422-430(2011).
[31] X Wang S, B Wu, N Yang P. Assessing the changes in land use and ecosystem services in an oasis agricultural region of Yanqi Basin, Northwest China. Environmental Monitoring & Assessment, 186, 8343-8357(2014).
[32] J Wang X, T Yu Z, P Wang J et al. Carbon Cycle in the Changing Arid Land of China. Singapore:. Springer.(2018).
[33] J Xiao, Z Jin, W Jin et al. Major ion chemistry, weathering process and water quality of natural waters in the Bosten Lake catchment in an extreme arid region, NW China. Environmental Earth Sciences, 73, 3697-3708(2015).
[34] X Xie, Y Cui. Development and test of SWAT for modeling hydrological processes in irrigation districts with paddy rice. Journal of Hydrology, 396, 61-71(2011).
[35] Y Yu, Y Pi Y, X Yu et al. Climate change, water resources and sustainable development in the arid and semi-arid lands of Central Asia in the past 30 years. Journal of Arid Land, 11, 1-14(2019).
[36] Y Zhang X, H Zhang M. Modeling effectiveness of agricultural BMPs to reduce sediment load and organophosphate pesticides in surface runoff. Science of the Total Environment, 409, 1949-1958(2011).
[37] T Zuo Q, F Zhou K, J Xia et al. A quantified study method and its application to sustainable management of water resources in arid basins. Science in China (Series D), 50, 9-15(2007).


Set citation alerts for the article
Please enter your email address

© Copyright 2018-2021 | Chinese Laser Press. All Rights Reserved 沪ICP备15018463号-20