• Photonics Research
  • Vol. 12, Issue 3, 456 (2024)
Chi Liu1, Cheng Jin1, Junhao Deng2、3, Junhao Liang1, Licheng Zhang3, and Lingjie Kong1、4、*
Author Affiliations
  • 1State Key Laboratory of Precision Measurement Technology and Instruments, Department of Precision Instrument, Tsinghua University, Beijing 100084, China
  • 2School of Life Sciences, Tsinghua University, Beijing 100084, China
  • 3Senior Department of Orthopedics, The Fourth Medical Center of Chinese PLA General Hospital, Beijing 100853, China
  • 4IDG/McGovern Institute for Brain Research, Tsinghua University, Beijing 100084, China
  • show less
    DOI: 10.1364/PRJ.504895 Cite this Article Set citation alerts
    Chi Liu, Cheng Jin, Junhao Deng, Junhao Liang, Licheng Zhang, Lingjie Kong. Simultaneous dual-region two-photon imaging of biological dynamics spanning over 9 mm in vivo[J]. Photonics Research, 2024, 12(3): 456 Copy Citation Text show less
    System scheme of simultaneous dual-region imaging microscopy. Two excitation beams with a relative time delay of 6.25 ns are introduced by an optical delay line of ∼1.8 m. These two beams are relayed to different positions of objective back pupil and further reflected to two ROIs by the MMU. The excited fluorescence signals are detected by a PMT and amplified, followed by temporal demultiplexing with synchronization signals from the clock of the laser. L, lens; EOM, electro-optic modulator; 1/2 WP, halfwave plate; PBS, polarization beam splitter; BE, beam expander; SL, scan lens; TL, tube lens; DIC, dichroic mirror; PMT, photomultiplier tube; TIA, transimpedance amplifier.
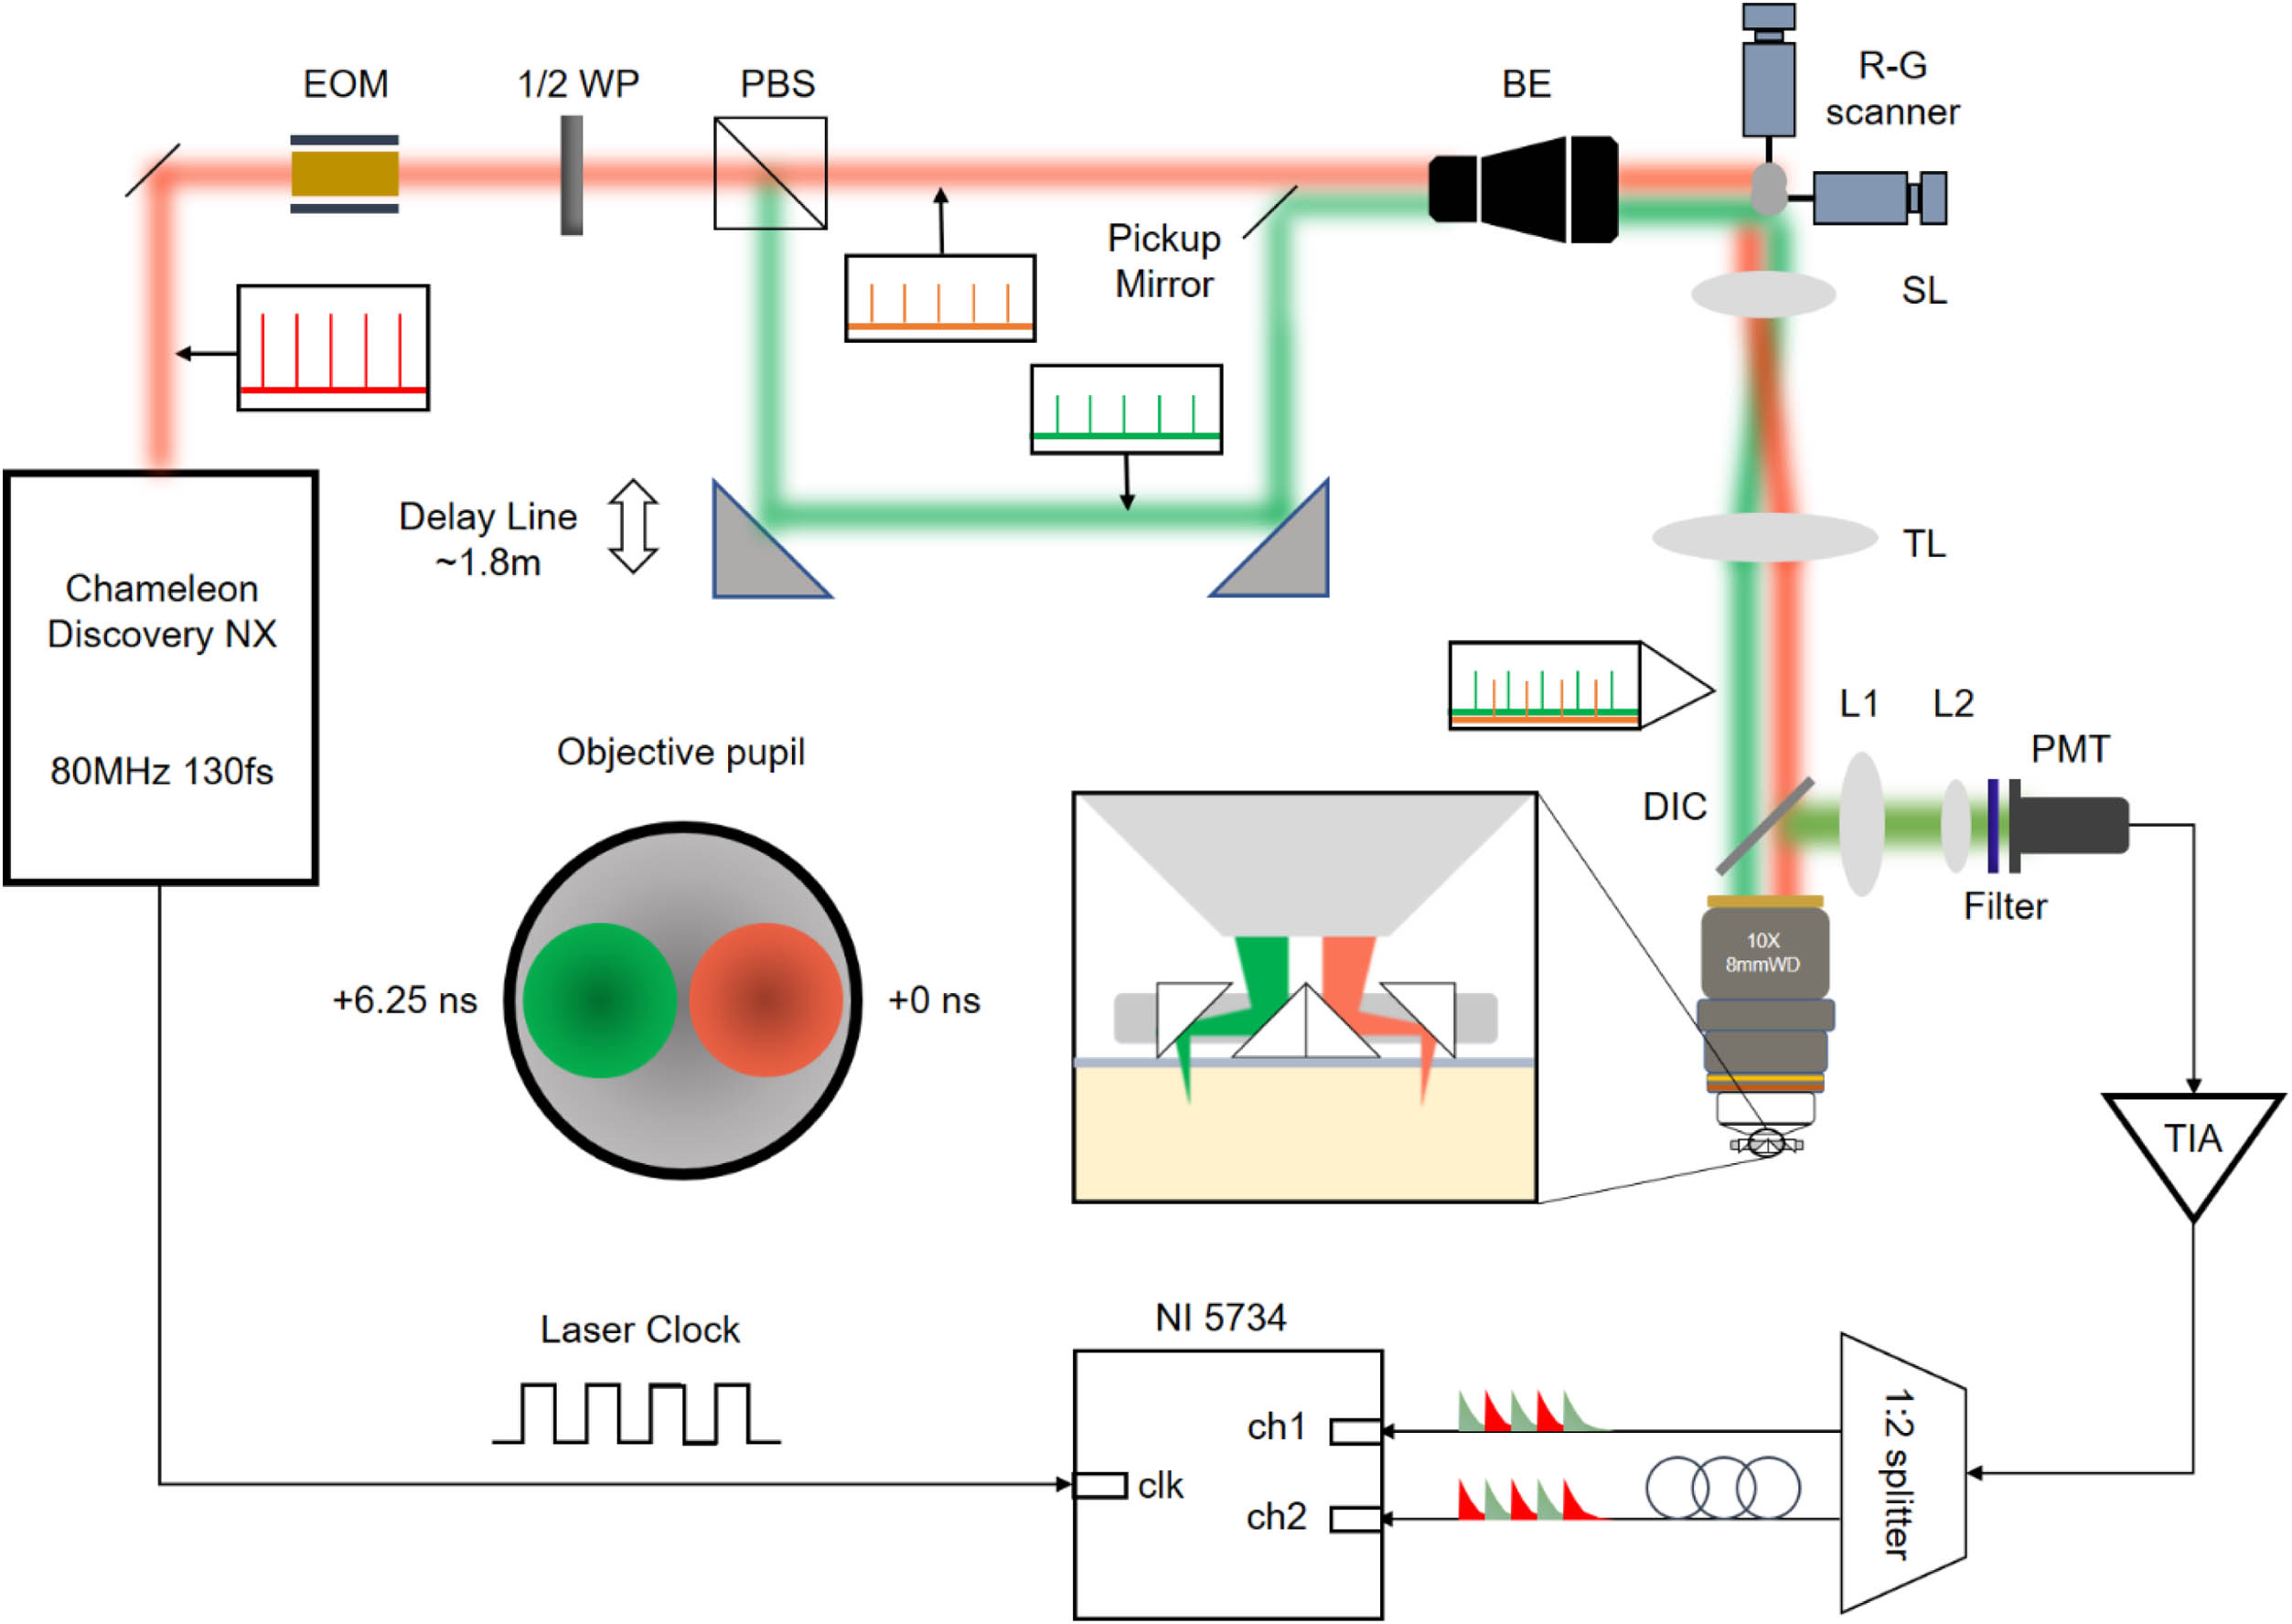
    Fig. 1. System scheme of simultaneous dual-region imaging microscopy. Two excitation beams with a relative time delay of 6.25 ns are introduced by an optical delay line of 1.8  m. These two beams are relayed to different positions of objective back pupil and further reflected to two ROIs by the MMU. The excited fluorescence signals are detected by a PMT and amplified, followed by temporal demultiplexing with synchronization signals from the clock of the laser. L, lens; EOM, electro-optic modulator; 1/2 WP, halfwave plate; PBS, polarization beam splitter; BE, beam expander; SL, scan lens; TL, tube lens; DIC, dichroic mirror; PMT, photomultiplier tube; TIA, transimpedance amplifier.
    Drawings and photos of the MMU, and system resolution calibration. (a) Top and side views of the MMU. (b) Photo of MMU with d=3 (left) and d=4 (right), corresponding to 2.5 mm working distance, 7 mm center interval of the effective FoV and 1.5 mm working distance, 9 mm center interval of the effective FoV, respectively. (c) Drawing of the 3D printing objective sleeve. (d) Photo of the 3D printing objective sleeve. (e) XY and XZ sections of PSF of region 1. Region 1 is the FoV corresponding to the excitation beam of + 0 ns time delay. Scale bar: 5 μm. (f) XY and XZ sections of PSF of region 2. Region 2 is the FoV corresponding to the excitation beam of + 6.25 ns time delay. (g)–(i) x, y, z intensity profiles (dot) and their Gaussian fitting curves (curve) of the system PSF of region 1. (j)–(l) x, y, z intensity profiles (dot) and their Gaussian fitting curves (curve) of the system PSF of region 2.
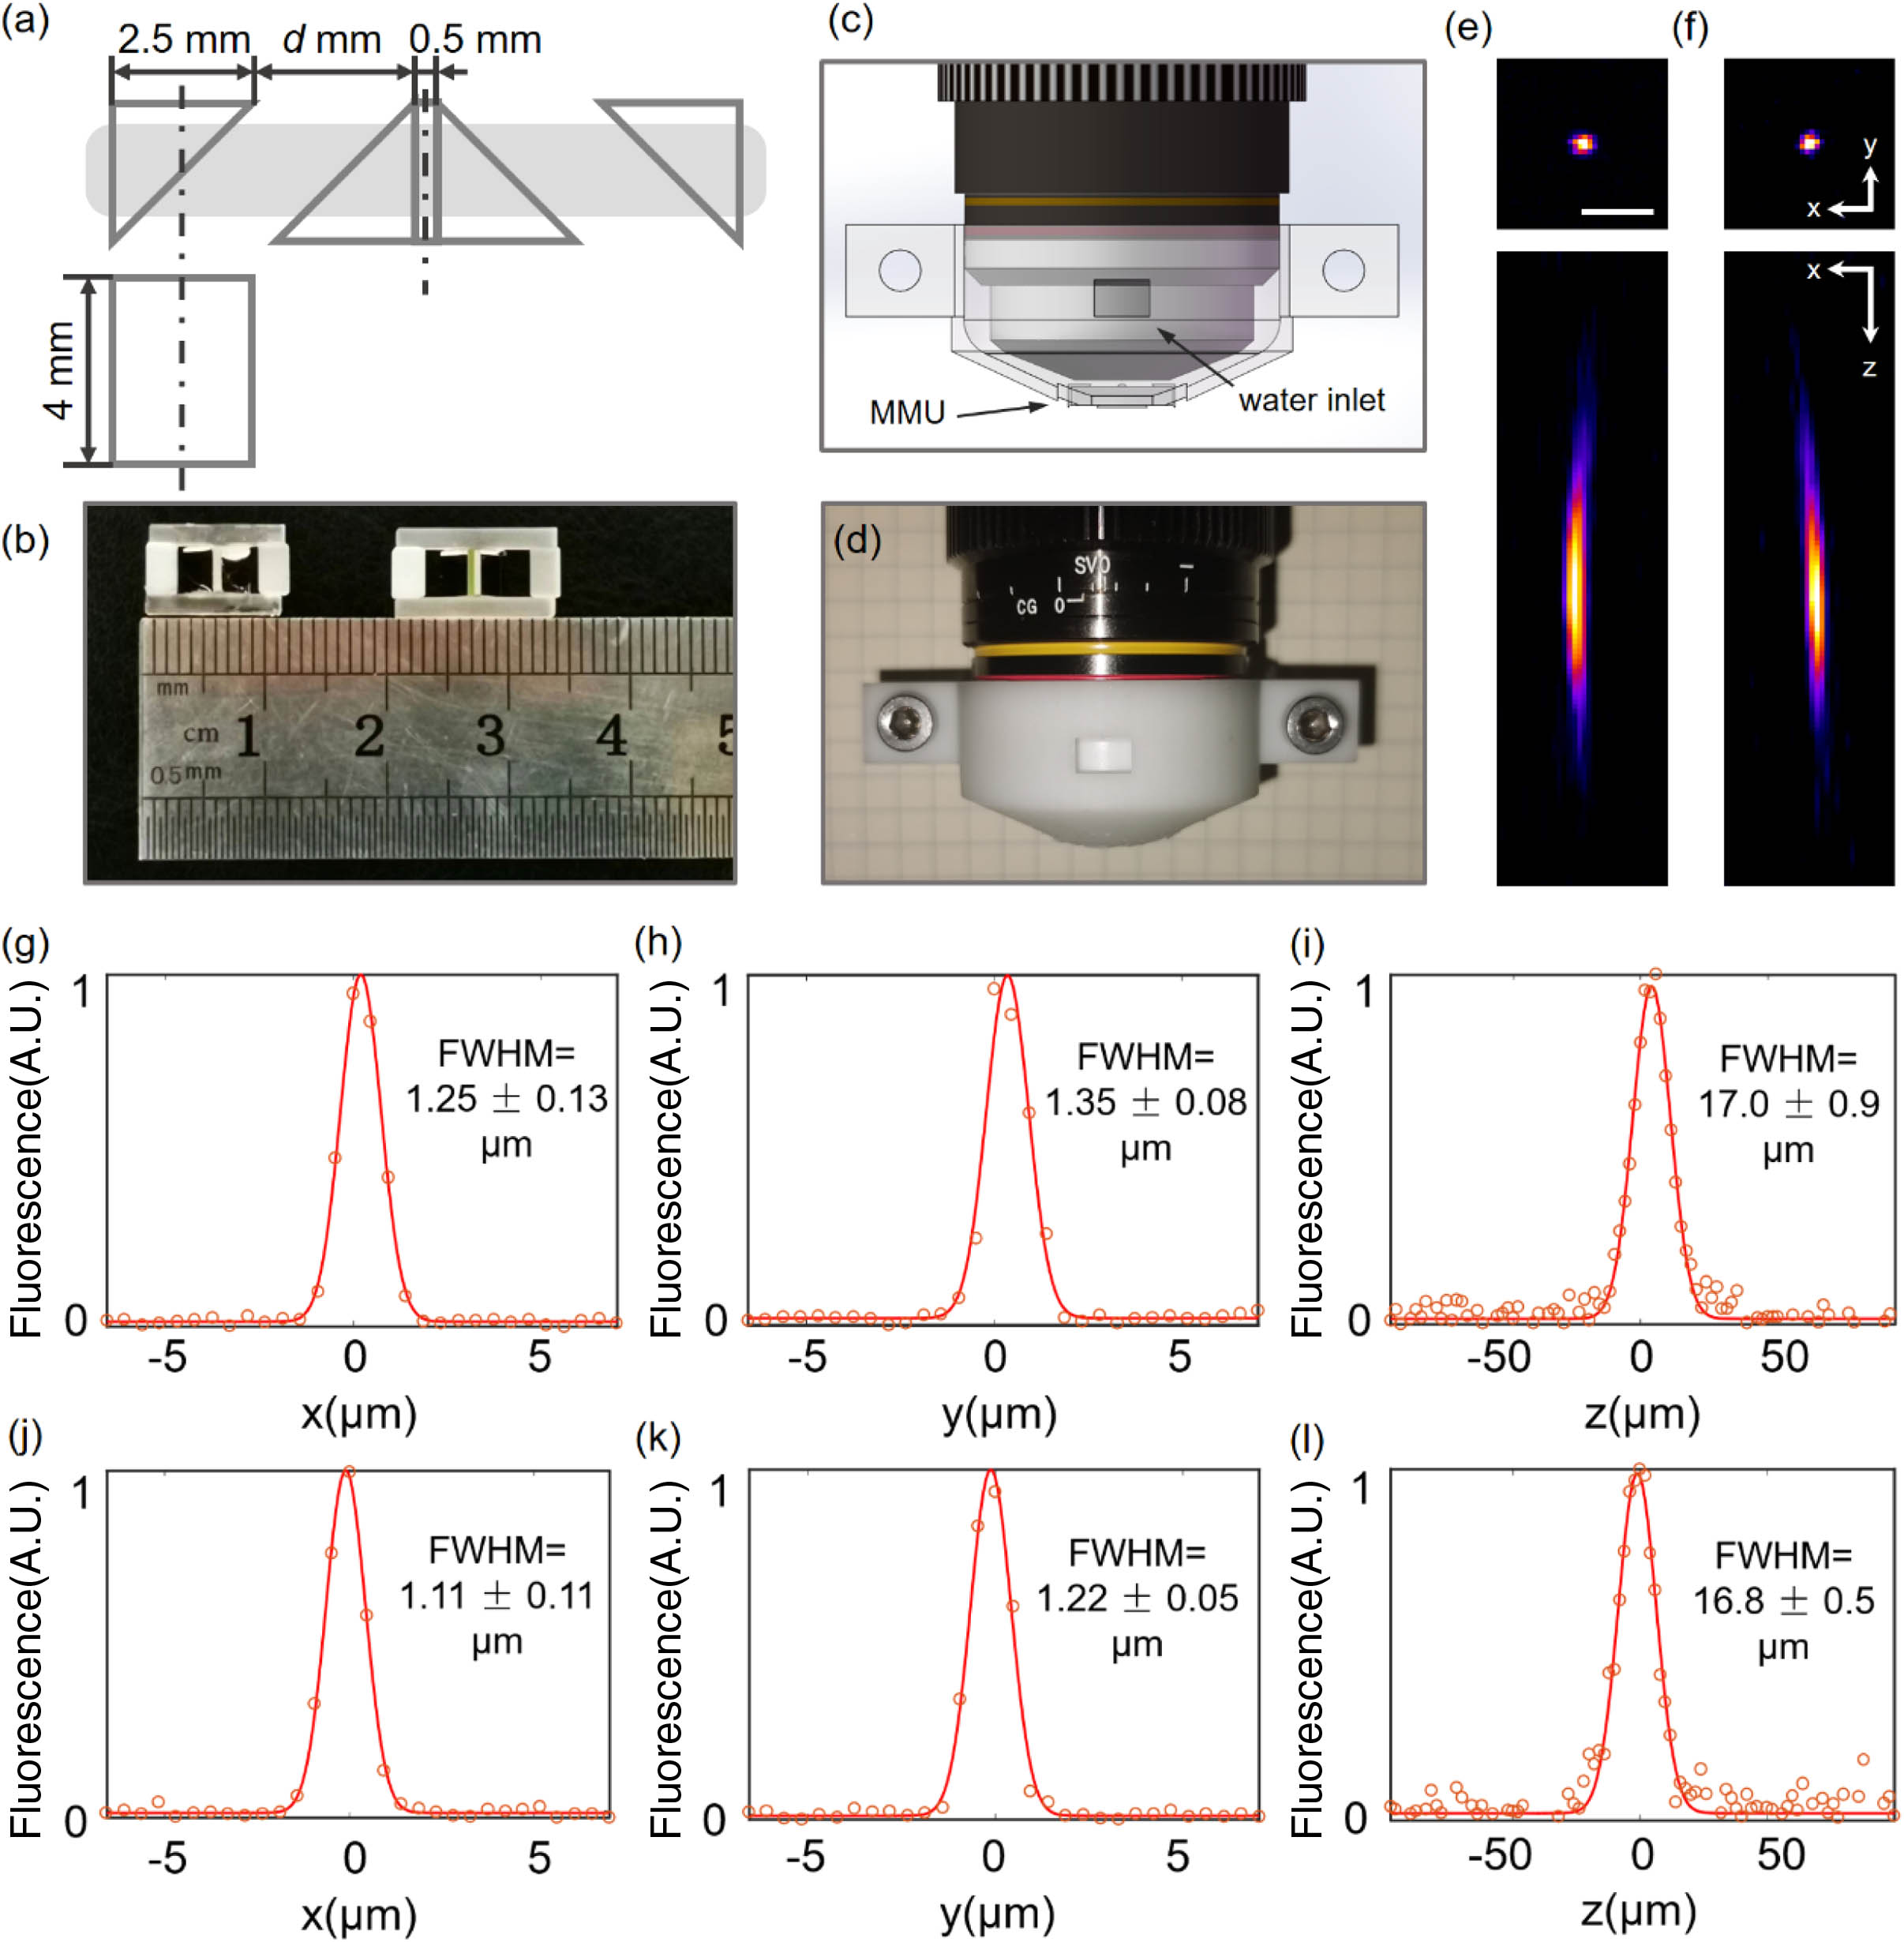
    Fig. 2. Drawings and photos of the MMU, and system resolution calibration. (a) Top and side views of the MMU. (b) Photo of MMU with d=3 (left) and d=4 (right), corresponding to 2.5 mm working distance, 7 mm center interval of the effective FoV and 1.5 mm working distance, 9 mm center interval of the effective FoV, respectively. (c) Drawing of the 3D printing objective sleeve. (d) Photo of the 3D printing objective sleeve. (e) XY and XZ sections of PSF of region 1. Region 1 is the FoV corresponding to the excitation beam of + 0 ns time delay. Scale bar: 5 μm. (f) XY and XZ sections of PSF of region 2. Region 2 is the FoV corresponding to the excitation beam of + 6.25 ns time delay. (g)–(i) x, y, z intensity profiles (dot) and their Gaussian fitting curves (curve) of the system PSF of region 1. (j)–(l) x, y, z intensity profiles (dot) and their Gaussian fitting curves (curve) of the system PSF of region 2.
    Simultaneous dual-region imaging of a Thy1-YFP mouse brain section and an H&E stained pathological section. (a) 3D model of MMU. (b) Whole slice imaging of the coronal section from Thy1-YFP mouse brain. The interval between two simultaneous imaging ROIs is 7 mm. Scale bar: 1 mm. (c), (d) Two-photon fluorescence imaging results corresponding to the regions in cyan box and pink box, respectively, in (b). Scale bar: 100 μm. (e) Whole slide bright field image of the pathological slice (thickness: 3 μm). The interval between two simultaneous imaging ROIs is 9 mm. Scale bar: 3 mm. (f), (g) Zoom-in views of the regions in the cyan box and red box, respectively, in (e). Scale bar: 100 μm. (h), (i) Two-photon fluorescence imaging results corresponding to the regions in the cyan box and red box, respectively, in (e). Scale bar: 100 μm.
    Fig. 3. Simultaneous dual-region imaging of a Thy1-YFP mouse brain section and an H&E stained pathological section. (a) 3D model of MMU. (b) Whole slice imaging of the coronal section from Thy1-YFP mouse brain. The interval between two simultaneous imaging ROIs is 7 mm. Scale bar: 1 mm. (c), (d) Two-photon fluorescence imaging results corresponding to the regions in cyan box and pink box, respectively, in (b). Scale bar: 100 μm. (e) Whole slide bright field image of the pathological slice (thickness: 3 μm). The interval between two simultaneous imaging ROIs is 9 mm. Scale bar: 3 mm. (f), (g) Zoom-in views of the regions in the cyan box and red box, respectively, in (e). Scale bar: 100 μm. (h), (i) Two-photon fluorescence imaging results corresponding to the regions in the cyan box and red box, respectively, in (e). Scale bar: 100 μm.
    Simultaneous dual-region imaging of neuronal activities in mouse cortex in vivo. (a) Wide field image of the mouse brain cortex under the craniotomy window. B: location of bregma. L: location of lambda. Scale bar: 1 mm. (b) Neuronal activities extracted from the simultaneous dual-region recording in ΔF/F. Colors of boxes denote different regions in (a). Cyan: Region 1. Pink: Region 2. (c) Calcium traces of selected neurons from Region 1. (d) Calcium traces of selected neurons from Region 2. (e) Neurons in two regions and their correlations based on calcium activities. Scale bar: 100 μm. Red lines between two regions link pairs of neurons of high correlation coefficients (CCs) from different regions (CC>0.5). Grey lines link pairs of neurons of correlation coefficients within one region (left, CC>0.63; right, CC>0.43). (f) Correlation coefficient matrix from all traces in (b) of Region 1. (g) Correlation coefficient matrix from all traces in (b) of Region 2. (h) Distribution of the correlation coefficient in Region 1, Region 2, and cross regions.
    Fig. 4. Simultaneous dual-region imaging of neuronal activities in mouse cortex in vivo. (a) Wide field image of the mouse brain cortex under the craniotomy window. B: location of bregma. L: location of lambda. Scale bar: 1 mm. (b) Neuronal activities extracted from the simultaneous dual-region recording in ΔF/F. Colors of boxes denote different regions in (a). Cyan: Region 1. Pink: Region 2. (c) Calcium traces of selected neurons from Region 1. (d) Calcium traces of selected neurons from Region 2. (e) Neurons in two regions and their correlations based on calcium activities. Scale bar: 100 μm. Red lines between two regions link pairs of neurons of high correlation coefficients (CCs) from different regions (CC>0.5). Grey lines link pairs of neurons of correlation coefficients within one region (left, CC>0.63; right, CC>0.43). (f) Correlation coefficient matrix from all traces in (b) of Region 1. (g) Correlation coefficient matrix from all traces in (b) of Region 2. (h) Distribution of the correlation coefficient in Region 1, Region 2, and cross regions.
    Simultaneous dual-region imaging of FITC-labeled vessels in mouse brain and in mouse spinal cord in vivo. (a) Photo of the craniotomy window on the mouse brain. (b), (c) Two-photon fluorescence imaging results corresponding to the regions in cyan box and pink box in (a), respectively. Scale bar: 100 μm. (d) Simultaneous recording of vascular dilation in two different regions of mouse brain. Pink and cyan: diameter changes of the indicated vessel in (b) and (c), respectively. (e) Photo of the craniotomy window on the mouse spinal cord. (f), (g) Two-photon fluorescence imaging results corresponding to the regions in the cyan box and pink box in (e), respectively. Scale bar: 100 μm. (h) Zoom-in views of the area labeled in the dashed box in (f) at different time points. Scale bar: 30 μm.
    Fig. 5. Simultaneous dual-region imaging of FITC-labeled vessels in mouse brain and in mouse spinal cord in vivo. (a) Photo of the craniotomy window on the mouse brain. (b), (c) Two-photon fluorescence imaging results corresponding to the regions in cyan box and pink box in (a), respectively. Scale bar: 100 μm. (d) Simultaneous recording of vascular dilation in two different regions of mouse brain. Pink and cyan: diameter changes of the indicated vessel in (b) and (c), respectively. (e) Photo of the craniotomy window on the mouse spinal cord. (f), (g) Two-photon fluorescence imaging results corresponding to the regions in the cyan box and pink box in (e), respectively. Scale bar: 100 μm. (h) Zoom-in views of the area labeled in the dashed box in (f) at different time points. Scale bar: 30 μm.
    Chi Liu, Cheng Jin, Junhao Deng, Junhao Liang, Licheng Zhang, Lingjie Kong. Simultaneous dual-region two-photon imaging of biological dynamics spanning over 9 mm in vivo[J]. Photonics Research, 2024, 12(3): 456
    Download Citation