
Zilong Zhang, Yuan Gao, Xiangjia Li, Xin Wang, Suyi Zhao, Qiang Liu, Changming Zhao, "Second harmonic generation of laser beams in transverse mode locking states," Adv. Photon. 4, 026002 (2022)
- Advanced Photonics
- Vol. 4, Issue 2, 026002 (2022)
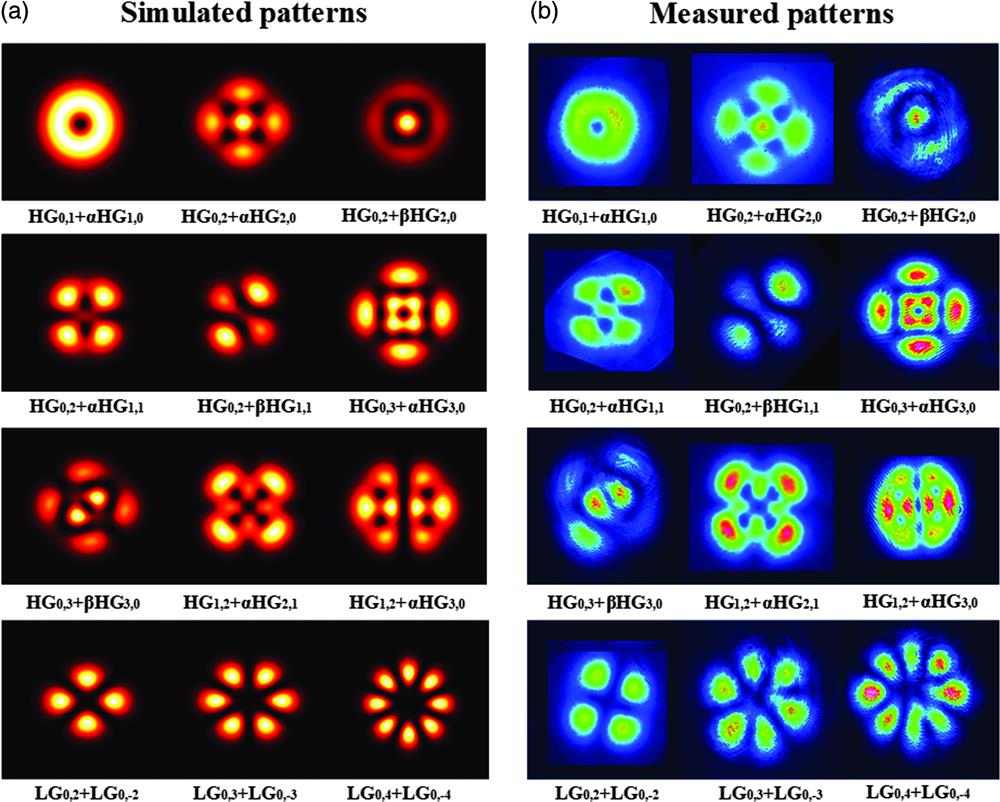
Fig. 1. Several examples of the fundamental frequency beam patterns in TML states to show the possibility of the generation of TML beams by a microchip cavity. (a) Simulations of the far-field beam pattern of TML modes; (b) corresponding experimental results of the far-field beam patterns of TML modes. Here,
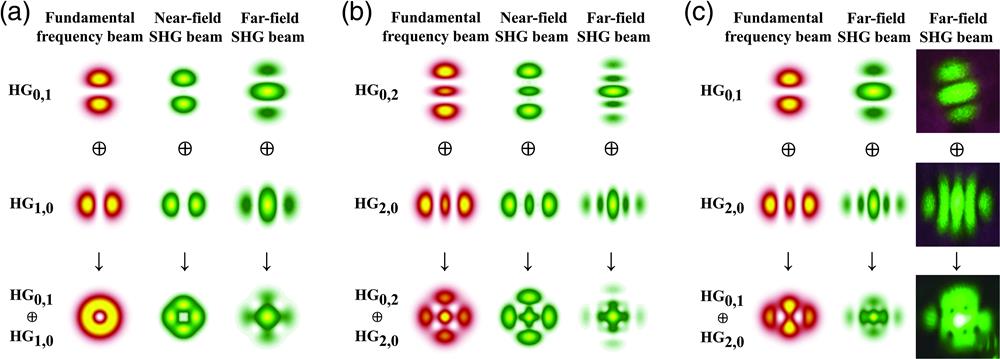
Fig. 2. The mode compositions in (a), (b), and (c) are
Fig. 3. Far-field SHG beam patterns of various TML beams marked on the Poincaré sphere. (a) The point (
Fig. 4. Simulated far-field beam patterns of SHG beams corresponding to different TML beams. In column VIII, the TML beams’ equations based on Eq. (1) are given. In rows (a) to (g) and rows (h) to (j), different far-field patterns of SHG beams of transverse mode locking states with two HG and LG modes are given, respectively. Here,
Fig. 5. Variations of two SHG beam patterns of TML beams in the near field. The upper one is the SHG beam of the TML beam of
Fig. 6. Diagram of (a) the experimental principle and (b) setup of the SHG process of TML beams. In panel (a), 1: Nd:YAG microchip; 2: Cr:YAG microchip; 3: LTO, LiTaO3 microchip; 4: DBS, dichroic beam splitter; 5: 532 nm filter; 6: 1064 nm filter; and a , b , c represent the crystallographic axes; c is also the optical axis. (b) The experimental setup and some beam patterns of both the fundamental frequency and SHG beams.
Fig. 7. The experimental and simulated results for the SHG of TML beams that are composed of
Fig. 8. The experimental and simulated results for the SHG of TML beams that are composed of


Set citation alerts for the article
Please enter your email address

© Copyright 2018-2021 | Chinese Laser Press. All Rights Reserved 沪ICP备15018463号-20