
Binbin Zhu, Shaosheng Fan. Reading Method of Substation Pointer Meter in Rain-Fog Environment[J]. Laser & Optoelectronics Progress, 2021, 58(24): 2410008
- Laser & Optoelectronics Progress
- Vol. 58, Issue 24, 2410008 (2021)
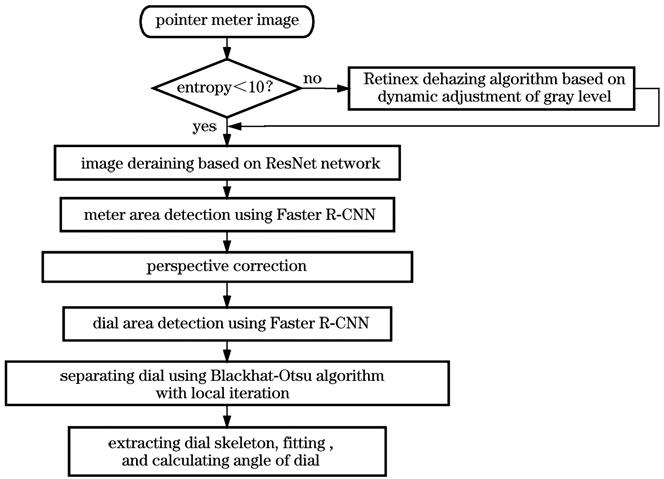
Fig. 1. Flow chart of instrumental detection and reading recognition
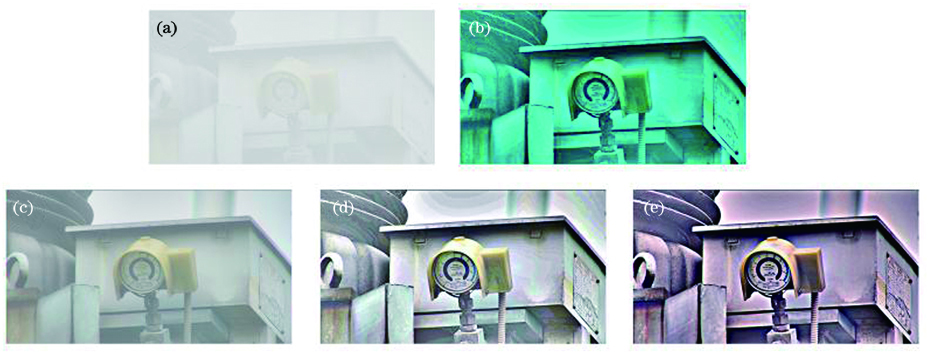
Fig. 2. Dehazing results under different D. (a) Hazy image; (b) image before mapping; (c) dehazing result under D=1.9; (d) dehazing result under D=2.3; (e) dehazing result under D=2.7
Fig. 3. Structural diagrams of ResNet network. (a) Residual unit; (b) improved residual unit; (c) our deraining network
Fig. 4. Comparison of image pixel distributions. (a) Histogram of image; (b) histogram of detail layer
Fig. 5. Extraction process of pointer. (a) Dial positioning; (b) dial correction and pointer extraction
Fig. 6. Comparison of dehazing images. (a) Hazy images; (b) dehazing images using dark channel; (c) dehazing images using MSRCR; (d) our dehazing images
Fig. 7. Contrast ofderaining images. (a)Rainy images; (b)deraining images without filter layer; (c) our deraining images
Fig. 8. Contrast of separation results of pointer area. (a1)(a2) Pointer area; (b1)(b2) adaptive Otsu algorithm; (c1)(c2) iterative threshold algorithm; (d1)(d2) our algorithm
| |||||||||||||||||||||||||||||||||||||||||||||||||||||
Table 1. Comparison of image entropy and MSE
|
Table 2. Dehazing process time comparison of images unit: s
|
Table 3. Comparison of image PSNR and SSIM
|
Table 4. Angle recognition results of meter reading

Set citation alerts for the article
Please enter your email address
© Copyright 2018-2021 | Chinese Laser Press. All Rights Reserved 沪ICP备15018463号-20