
Chuan NONG, Qiu YIN, Ci SONG, Jiong SHU. Sensitivity analysis of the satellite infrared hyper-spectral atmospheric sounder GIIRS on FY-4A[J]. Journal of Infrared and Millimeter Waves, 2021, 40(3): 353
- Journal of Infrared and Millimeter Waves
- Vol. 40, Issue 3, 353 (2021)
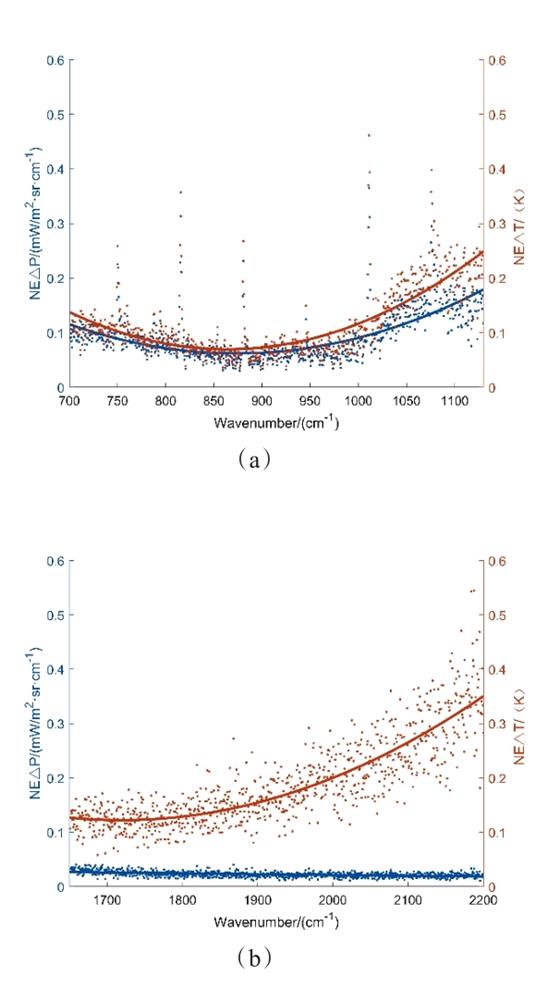
Fig. 1. The FY-4A GIIRS sounder noise sensitivity @300K for (a) long-wave band and (b) medium-wave band
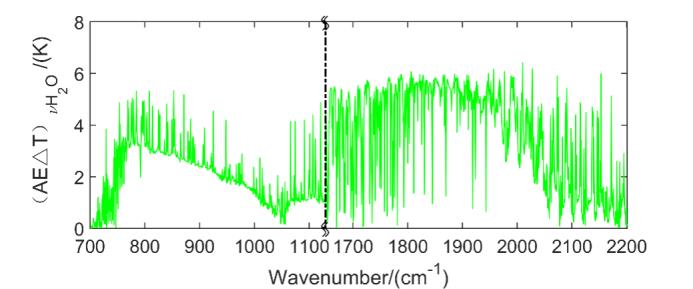
Fig. 2. The change of atmospheric water vapor sensitivity
Fig. 3. Atmospheric water vapor sensitivity
Fig. 4. The change of atmospheric ozone sensitivity
Fig. 5. The change of atmospheric CO2 sensitivity
Fig. 6. The change of atmospheric N2O sensitivity
Fig. 7. The change of atmospheric CH4 sensitivity
Fig. 8. The change of atmospheric temperature sensitivity
Fig. 9. Atmospheric temperature sensitivity
Fig. 10. The change of surface temperature error sensitivity
|
Table 1. The statistical characteristics of water vapor sensitivity
|
Table 2. The statistical characteristics of water vapor sensitivity
|
Table 3. The statistical results of the surface temperature error sensitivity
|
Table 4. The statistical results of the surface temperature error sensitivity

Set citation alerts for the article
Please enter your email address
© Copyright 2018-2021 | Chinese Laser Press. All Rights Reserved 沪ICP备15018463号-20