Integrating novel materials is critical for the ultrasensitive, multi-dimensional detection of biomolecules in the terahertz (THz) range. Few studies on THz biosensors have used semiconductive active layers with tunable energy band structures. In this study, we demonstrate three THz biosensors for detecting casein molecules based on the hybridization of the metasurface with graphitic carbon nitride, graphene, and heterojunction. We achieved low-concentration detection of casein molecules with a 3.54 ng/mL limit and multi-dimensional sensing by observing three degrees of variations (frequency shift, transmission difference, and phase difference). The favorable effect of casein on the conductivity of the semiconductive active layer can be used to explain the internal sensing mechanism. The incorporation of protein molecules changes the carrier concentration on the surface of the semiconductor active layer via the electrostatic doping effect as the concentration of positively charged casein grows, which alters the energy band structure and the conductivity of the active layer. The measured results indicate that any casein concentration can be distinguished directly by observing variations in resonance frequency, transmission value, and phase difference. With the heterojunction, the biosensor showed the highest response to the protein among the three biosensors. The Silvaco Atlas package was used to simulate the three samples’ energy band structure and carrier transport to demonstrate the benefits of the heterojunction for the sensor. The simulation results validated our proposed theoretical mechanism model. Our proposed biosensors could provide a novel approach for THz metasurface-based ultrasensitive biosensing technologies.
1. INTRODUCTION
As a typical non-metallic conjugated polymer, two-dimensional graphitic carbon nitride (2D ) has received increasing attention in heterogeneous catalysis, photoelectric conversion, sensing, and imaging owing to its appealing electronic band structure, unique chemical structure, and excellent optoelectronic properties [1,2]. Furthermore, its chemical composition and band structure (with a bandgap of around 2.7 eV) are tunable. Because of the luminescent characteristics and biocompatibility of , it has the potential to broaden its application in the field of biosensing [3–6]. Currently, various factors limit the biosensing applications of based on their photoluminescence and electrochemiluminescence properties [7,8]. It is urgent to develop novel structures that take advantage of the excellent properties of units for biosensing. Terahertz (THz) metamaterial biosensors combine the local near-field enhancement of metamaterials with the inherent benefits of THz waves in the biological field, showing great potential in the trace detection of biological macromolecules [9–13]. THz metamaterial biosensors research has spread across many biomedical fields, including biological solution detection, microbial detection, and tumor cell screening. The concentration change in biomolecules can be detected by measuring the shift in the frequency range of resonant positions [14–18]. Therefore, the sensitivity of those biosensors needs further improvement. Combining hybridization metamaterials and the tunable energy band features of results in a novel technique for accomplishing biosensing in the THz range. However, single has significant limitations, especially a high recombination rate of photogenerated electron–hole pairs, which limits its future application. To suppress the recombination of photogenerated electron–hole pairs, is recombined with other materials, and the synergistic effect between the two materials can enhance their sensing performance.
Graphene is a 2D, single-atomic layer of carbon material with excellent properties for many potential device applications in the THz range [19–21]. However, graphene has a zero bandgap, which limits its application. The fabrication of graphene–semiconductor heterojunction (HTJ) is one of the approaches suggested for tuning the bandgap [22–24]. Recent studies have taken advantage of the unique properties of different 2D materials by forming an HTJ, which is a vertical stack of dissimilar 2D materials held together by van der Waals (VdW) forces. [25], [26], and [27] VdW HTJ forces have been extensively studied experimentally and theoretically [28,29]. They preserve their intrinsic electronic properties and create outstanding opportunities for engineering applications. In addition, vertical stacking of magnetic metal phases with graphene may be beneficial for promising graphene-based spintronic applications. Most current research on VdW HTJs is based on semiconductor optoelectronic devices and there are few reports on the application of VdW HTJs in biosensing, particularly research on combining with THz metamaterials.
In this study, we propose three THz metasurface biosensors hybridizing three different semiconductor active layers for sensing protein molecules, offering a novel strategy for low-concentration biomolecule detection. The designed metasurface comprises D- and C-shaped metals that produce a dipole resonance of approximately 1.4 THz in response to THz waves with varying protein concentrations. The three different semiconductor active layers are , graphene, and heterojunction. As a proof of concept, the transmission spectra of the three biosensors were measured with increasing concentrations of casein via the electrostatic doping effect. Some obvious dependences are observed, such as frequency shift, increase in phase difference, and decrease in transmission amplitude with increasing casein concentration. These findings indicate that our biosensors have the ability to identify casein concentrations. Our biosensors can detect casein concentrations as low as 3.54 ng/mL. More importantly, when the casein concentration reaches its maximum (), the frequency shift and phase difference in our measurements reach their maxima, which are up to 251 GHz and 327°, respectively, for the HTJ biosensors, successfully realizing ultrasensitive, multi-dimensional biosensing. Finally, the Silvaco Atlas package was used to simulate the energy band structure and carrier transport of the three biosensors. The simulation results successfully validated the correctness of our proposed theory model. Our proposed technique could be a viable alternative to future THz biosensing technologies.
Sign up for Photonics Research TOC. Get the latest issue of Photonics Research delivered right to you!Sign up now
2. DESIGN AND METHODS
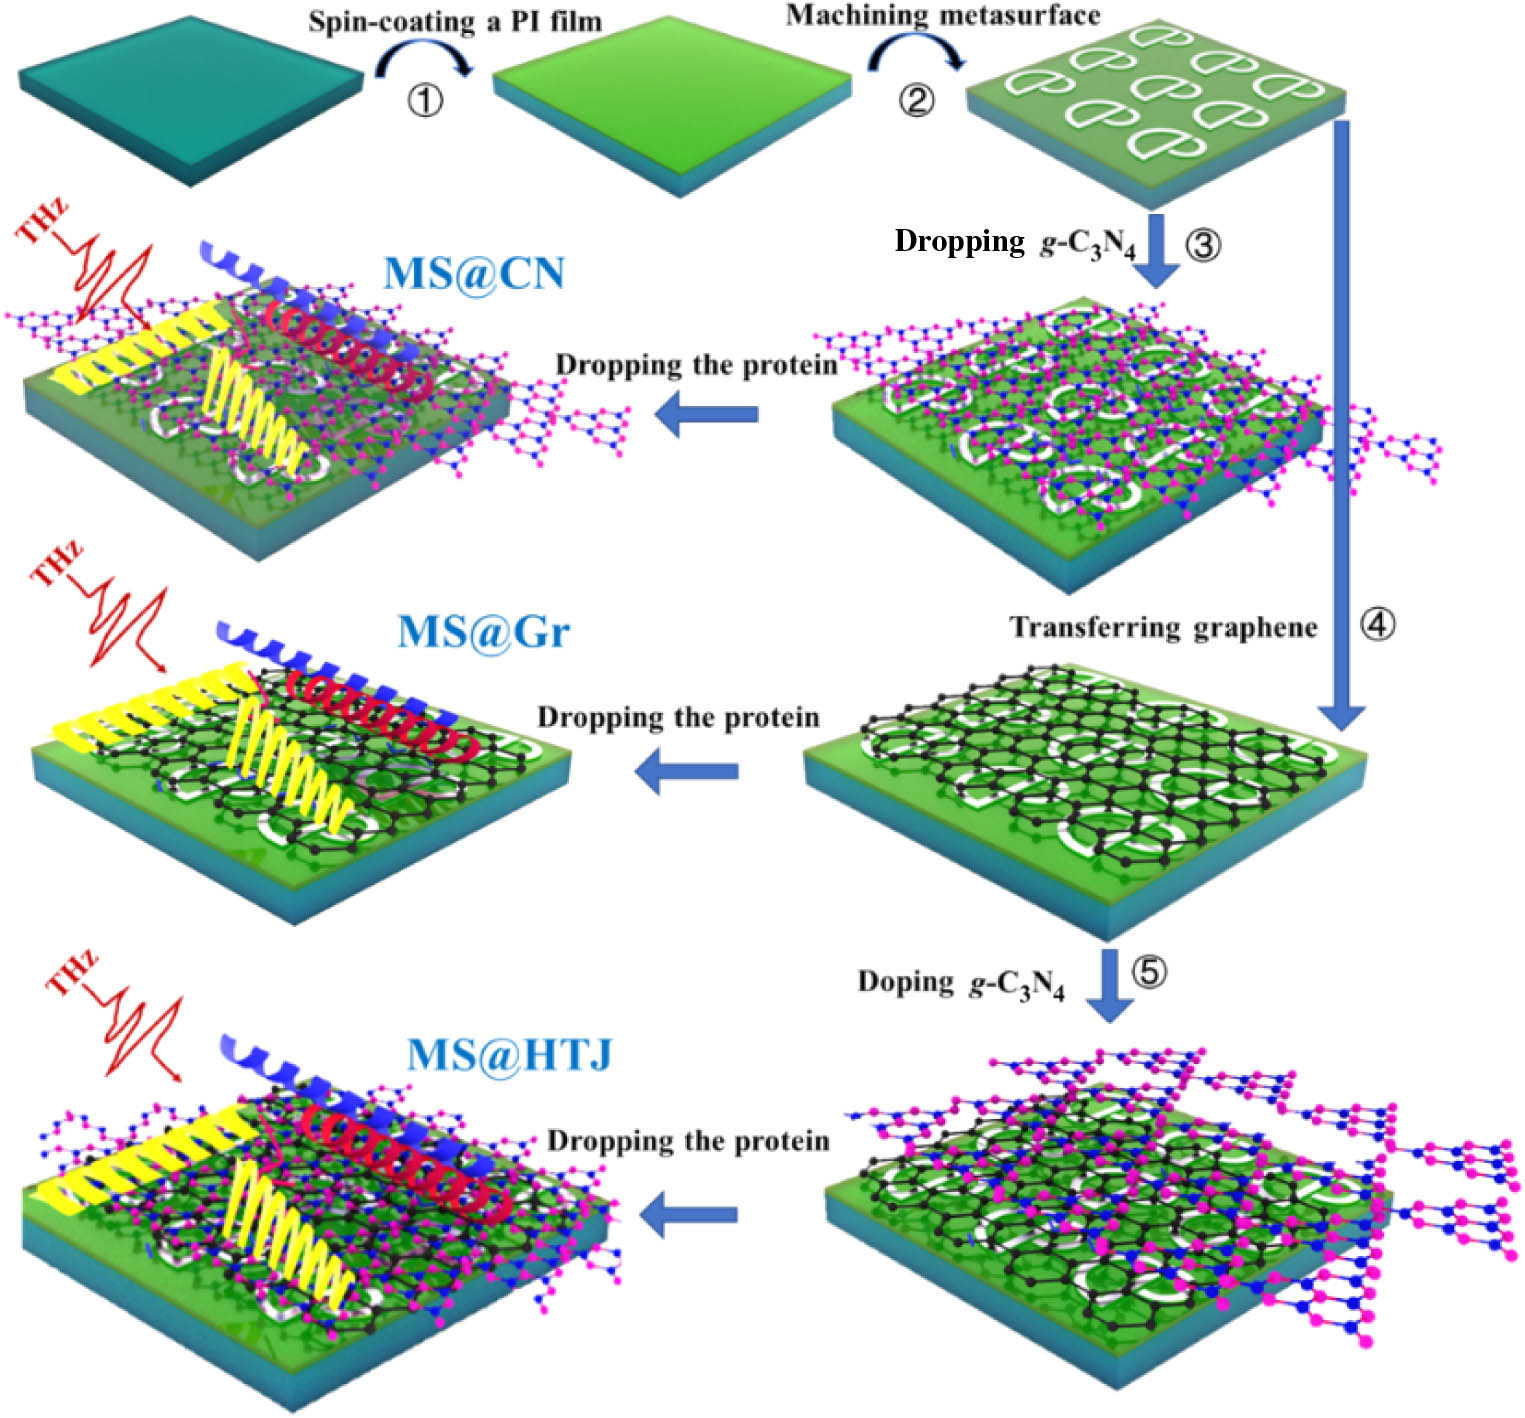
Figure 1 illustrates an overview of the fabrication process for the three proposed THz metasurface biosensors. First, a 2 μm thick polyimide (PI) film is spin-coated onto a 300 μm thick quartz substrate () (Fig. 1, ①). Second, aluminum microstructure units are fabricated on the PI film using photolithography technology (Fig. 1, ②). Finally, is spin-coated and a graphene film is transferred onto the metasurface to produce samples 1 (MS@CN) and 2 (MS@Gr) of the THz metamaterial biosensor, respectively (Fig. 1, ③ and ④). is spin-coated on the surface of sample 2 to obtain sample 3 (MS@HTJ) (Fig. 1, ⑤). The biosensing feature of the three samples was experimentally characterized via an 8f confocal THz time-domain spectroscopy. Casein molecules were chosen as a probe analyte to verify the performance of the three biosensors (Fig. 1). We prepared suspensions with five different casein concentrations (CCs): , , , , and . All the experimental data presented in this work are averaged after three tests.
Figure 1.Schematic illustration of the fabrication of the three proposed biosensors.
Figure 2 shows the microstructure design and all geometric parameters of the proposed samples. Figure 2(a) shows a photomicrograph of a unit cell of the microstructure. It consists of D and C shapes with 0.2 μm thick aluminum. The geometric parameters for the D shape are μ and μ and for the C shape are μ, μ. The periodicity is 130 μm. Figure 2(c) shows the Raman spectra of graphene by 514 nm excitation. The figure shows the G () and 2D peaks (), as well as the full width at half-maximum of the G peak (). These characteristics indicate that graphene has a high quality and is a monolayer [30]. Figure 2(d) shows the X-ray diffraction (XRD) pattern of powder. The XRD pattern shows diffraction peaks at 28.96° and no other redundant phases.
Figure 2.(a) Photomicrograph of a unit cell of the microstructure. Inset: picture of the sample. (b) Schematic of the unit cell, which consists of D and C shapes. The geometric parameters for D shape are μ and μ and for C shape are μ and μ. The periodicity is 130 μm. (c) Raman spectrum of graphene. Inset: schematic of the graphene sample. (d) X-ray diffraction (XRD) pattern of the film. Inset: representative scanning electron microscopy image of .
The proposed samples are simulated using a frequency-domain solver in CST Microwave Studio. The electric and magnetic boundary conditions were along the and directions, respectively, as shown in Fig. 2(b). In the simulation, the permittivity values of the quartz substrate, polyimide, and are 3.84, 3.4, and 7.86, respectively [10,31]. The Drude model is used to describe the conductivity of monolayer graphene. The electric conductivity of aluminum is . The transmission was defined as , where and are the THz electric field amplitudes of the sample and reference, respectively, after Fourier transformation of the THz pulses [32].
The transmission spectra of the three proposed samples were measured and simulated, as shown in Fig. 3. A sharp resonance dip is exhibited in every transmission spectrum at around 1.4 THz. Further, the experiment results agree well with the simulation results except for a minor difference. These variations are due to unavoidable errors in the fabrication and measurement processes. In addition, the surface current distribution of three samples at 1.41 THz was simulated and shown in the insert of the transmission spectrum in Fig. 3. The surface currents in the D shape of the microstructures clearly follow symmetrical directions. This finding confirms that the resonance at 1.41 THz is caused by dipole resonance. Moreover, owing to the different responses of the three samples to electromagnetic resonance, the surface current intensities of the three samples differ significantly under the same conditions, with the MS@HTJ device exhibiting the strongest inhibitory effect on the surface current.
Figure 3.Left: schematic illustration of three biosensors. Right: simulated and experimental transmission spectrum of the three samples, (a) MS@CN sample, (b) MS@Gr sample, and (c) MS@HTJ sample.
The experimental transmission spectra of samples with different CCs were measured, as shown in Figs. 4(a)–4(c). To investigate the internal sensing mechanism for the three samples, we simulated the transmission spectra of three samples of with different conductivities, different Fermi levels of graphene, and different analyte refractive indices [Figs. 4(a1)–4(c1), respectively]. Moreover, the simulation in the transmission spectrum agreed well with the experimental measurements.
Figure 4.Simulated and experimental transmission spectrum of the three samples, (a) MS@CN, (b) MS@Gr, and (c) MS@HTJ, respectively.
Figure 4(a) shows the experimental transmission spectrum of the MS@CN sample with different CCs. The transmission amplitude of the resonance dip slightly decreases under CCs, ranging from 0 ng/mL to . In general, protein molecules have a positive charge in the aqueous environment. When the protein molecules are dropped onto the surface of as an analyte, the protein-induced electrostatic doping effect will cause charge accumulation in the layer. While its conductivity increases gradually, the loss of the incident terahertz wave increases, resulting in low transmission value. The results reveal that the MS@CN sample can accomplish low CC detection, but its performance as a sensor is poor. In other words, the transmission amplitudes at different CCs did not change much, and there was basically no frequency shift, indicating that alone responded weakly to changes in protein molecule concentration. To demonstrate sensing mechanism, we simulated the transmission spectra of the MS@CN sample under varied conductivities of , as shown in Fig. 4(a1). When the conductivity is increased from 1 to 125 S/m, the transmission amplitudes of the resonance dip decrease. The simulation and experimental results agree well.
Figure 4(b) shows the experimental transmission spectrum of the MS@Gr sample under different CCs. The results are very interesting, the frequency of the resonance dip shifts over a wide range, and a slight change in the transmission amplitude with the CC increases. When positively charged casein is coated onto the graphene surface, the Fermi level of graphene changes, the conductivity of graphene changes, and the resonance dip shifts via electrostatic doping effect. When CC increased from 0 to 56.09 ng/mL, the resonance dip only occurs with a decrease in transmission amplitude. When the CC reached 852.6 ng/mL, the resonance dip shifted over a wide frequency range, and the CC caused a significant change in graphene conductivity. As the CC continued to increase, the resonance dip shifted until the CC reached ; the saturation concentration and resonance dip shift reached their maximum values. To analyze the internal sensing mechanism, we simulated the transmission spectrum of the MS@Gr sample under varied Fermi levels of graphene, as shown in Fig. 4(b1). When the Fermi level of graphene changed from 0.1 to 0.2 eV, the frequency of the resonance dip shifted. The simulation and experimental results agree well.
Based on the research results of the above two biosensors, we designed and used the above two active materials to form a VdW HTJ and then studied the sensing performance of the MS@HTJ sample combined with the HTJ and the metasurface, as shown in Fig. 4(c). The results were as we expected; with the increase of the CC, the resonance dip shifted to the low-frequency direction, and when the concentration reached , the resonance dip stopped shifting. Because protein addition changes the charge carriers concentration at the HTJ surface and thus the conductivity via electrostatic doping effect, the frequency of the resonance dip shifts as the HTJ conductivity changes. For the MS@HTJ sample, we simulated the transmission spectrum with different refractive indices, as shown in Fig. 4(c1). The results show that as the refractive index increases, the resonance dip frequency gradually shifts to a low frequency. The simulation results are consistent with the experimental results. The correctness of our proposed theoretical model has been verified.
To further investigate the sensing mechanism of the three samples, we first explain the mechanism of the signal change in the MS@CN sample using the classical semiconductor conductivity formula , where is the electron charge; , are the electron and hole mobilities, respectively; and , are the electron and hole concentrations, respectively. According to the formula, when the positively charged protein is doped to the surface, it causes the rapid separation and migration of electrons at the interface, causing an instantaneous increase in the surface conductivity of . It enhances destructive interference of THz waves, ultimately causing a decrease in the transmission values at resonance dip as the CC increases. Figure 5(a) shows that the band structure of changes under different CCs. Region (i) in Figure 5(a) shows without protein, is in the inactive state of an n-type semiconductor and the conduction and valence bands are not bent. As the CC increases, it is equivalent to incorporating a positive charge on the surface, while a large number of electrons gather on the surface, causing the conduction and valence bands to bend, as shown in regions (ii) and (iii) in Fig. 5(a).
Figure 5.Schematic of the energy band structure under different casein concentrations: (a) , (b) graphene, and (c) heterojunction.
For the sensing mechanism of MS@Gr and MS@HTJ samples, we explain the frequency shift using the modified perturbation theory [13,17]. The electric field can be represented by two equations-based to in electromagnetic dynamics, as follows:
By applying the perturbation procedure to Eq. (1), we obtain the following formula for the change in the dielectric environment and angular frequency shift values:
Consider the case where the electric field decays exponentially along the direction normal to the material; calculated from Eq. (2) scales with the analytes as follows [17]:
In the case of local confinement, the surface conductivity of graphene is represented, including the interband term and the intraband term approximation [33,34]:
Here, is the angular frequency, is the electron charge, represents the Boltzmann constant, is the Fermi level of graphene, is the reduced Planck constant, refers to the relaxation time of graphene, and is the temperature in Kelvin. The permittivity of graphene is calculated by [35] where is the vacuum permittivity and is the thickness of graphene (1 nm).
For the MS@Gr and MS@HTJ samples, the surface conductivity can be changed when doping the samples with charged protein molecules by changing the Fermi level of graphene in Eq. (4). The dielectric constant of the graphene layer has been changed in Eq. (5). According to Eq. (2), because has been changed, resulting in a dielectric environment in the altered metamaterial, an increase in CC will increase the frequency shift . In this work, the graphene is synthesized using chemical vapor deposition and its Fermi level is downshifted through chemical doping, forming p-type doped graphene. The initial quasi-Fermi level () is in the valence band near the Dirac point [36–38]; see region (i) in Fig. 5(b). As the CC increases, the quasi-Fermi level upshifts from to [as shown in region (ii) in Fig. 5(b)] and then to [as shown in region (iii) in Fig. 5(b)], while graphene conductivity gradually decreases. The respective band structures of the MS@HTJ samples without containing casein are shown in region (i) in Fig. 5(c); the HTJ is formed by n-type and p-type graphene. The band structure at the interface in the MS@HTJ sample is compared to that of in the curved MS@CN sample. With the increase of CC, the bending degree of the band structure of is strengthened, while the Fermi level of graphene decreases. When the concentration increases to , the energy band of bends to the point where electrons transfer to the graphene interface, and thereby the Fermi level of graphene upshifts into the conduction band, as shown in region (iii) in Fig. 5(c).
In summary, the three samples demonstrated ultrasensitive, multi-dimensional protein sensing functions. To analyze and compare their sensing performances, we quantified the transmission amplitude, frequency shift, and phase difference at the resonant frequency of each sample, as shown in Figs. 6–8.
Figure 6.Dependence of (a) frequency and (b) transmission values on protein concentration increasing from 0 to 1.56 ng/mL. Dependence of (c) frequency and (d) transmission difference values on protein concentration increasing from 0 to 1.56 ng/mL.
Figure 7.Plots of energy bands along the vertical direction from the front surface to the rear surface of (a) , (d) graphene, and (g) heterojunction as a function of the positive fixed charges density () at the surface; activation energy () near the front surface of (b) , (e) graphene, and (h) heterojunction as a function of the positive fixed charge density () at the surface; electron concentration mapping for of (c) , (f) graphene, and (i) heterojunction.
Figure 8.Phase difference between the bare sensor () and each CC tested for the (a), (d) MS@CN sample, (b), (e) MS@Gr sample, and (c), (f) MS@HTJ sample.
The color curves in Figs. 6(a) and 6(b) show the frequency and transmission values of resonance in the three samples at various CCs. For the MS@CN sample, there was little shift in frequency with increasing CC; however, for the MS@Gr and MS@HTJ samples, there was a larger shift in frequency. Using the sample without protein as the initial value, the frequency shift of the resonances at different CCs was calculated for the three samples, as shown in Fig. 6(c). As the CC increases from to , the maximum of the MS@CN sample is 10 GHz. When the CC reaches , the maximum is 150 GHz for the MS@Gr sample. Simultaneously, for the MS@HTJ sample, when the CC increases, the changes from 32 GHz to the maximum value of 251 GHz. Compared with the other two samples, the presence of the HTJ causes the response of the resonance dip and the to demonstrate the largest values. In addition, the transmission value changes are different for the three samples. As shown in Fig. 6(b), with the increase of CC, the transmission value of the MS@CN sample decreases all the time, while the transmission values of the MS@Gr and MS@HTJ samples first decrease and then increase. Using the sample without protein as the initial value, the transmission difference for the resonances at different CCs was calculated for three samples, as shown in Fig. 6(d). As the CC increased, the change of the MS@CN sample gradually increased from 0.02 to 0.08, while the change of the MS@Gr sample first increased to 0.11 and then decreased to 0.09, and the change of the MS@HTJ sample was the least obvious; the largest value was 0.05. The MS@CN sample has the most noticeable change in the transmission value, while the MS@HTJ sample has the most noticeable frequency shift.
To demonstrate that the advantages of HTJ for the sensor come from the large-scale carrier transport caused by its internal electric potential, the Silvaco Atlas package was used to simulate the energy band structure and carrier transport of the three samples, as shown in Fig. 7. Silvaco Atlas is a 2D device simulation package used for structural modeling by solving a set of fundamental equations comprising the Poisson’s equation, the continuity equations, the transport equations, and the Fermi–Dirac statistics [39,40]. The electrical parameters of materials used in the Silvaco TCAD simulation are listed in Table 1. The device structures are shown in Fig. 1. In experiment, the protein solution has different positive fixed charges concentrations due to dilution. The interface charge density is specified in our simulation study. Figures 7(a)–7(c) show the energy bands and activation energies () of without/with positive fixed charges at the surface. Compared with the flat band condition under , the conduction band edge near the front surface is close to the Fermi level () of the substrate. Compared with surfaces without containing fixed charges, the electron concentration near the surface is much higher than the electron concentration inside [as shown in Fig. 7(c)]. Figure 7(b) indicates that the decreases from 0.357 eV for to 0.0398 eV for . Figures 7(d)–7(f) show the energy bands and activation energies of graphene without/with positive fixed charges at the surface. Figure 7(d) shows that the work function of graphene is not modulated by positive . Even though an external electrical field is present, the induced electron accumulation and hole repulsion can be ignored [as shown in Fig. 7(f)]. The modulation of the work function of graphene usually depends on its interaction with its counterpart material. Figure 7(e) shows that the of graphene of 0 eV is not affected by . The absence of a bandgap in graphene makes it semi-metallic. Figures 7(g)–7(i) show the energy bands of the HTJ without/with positive fixed charges at the surface of . For this structure, which is also called the Schottky junction, the conduction band edge () near the interface is close to the Fermi level () of the substrate, indicating electron accumulation at the interface. If a protein with positive fixed charges is added on the surface of , the bends toward the up to a magnitude depending on the density of the positive fixed charges (). The variation tendency as a function of in Fig. 7(h) indicates a high of 0.357 eV with a very low positive , and low values of 0.261 eV, 0.142 eV, and 0.02 eV for , , and , respectively. The decreased and indicate that the concentration of electrons increases in , resulting in the upshifting of the of its adjacent graphene. The above simulation results verify the correctness of our proposed theoretical model. It was the first time that Silvaco TCAD was used to analyze the internal sensing mechanism of THz sensors, which provides a new strategy for the application of HTJs in THz technology.
Electrical Parameters of Silvaco TCAD Simulation in This Work
Parameters
Graphene
Electron affinity (eV)
4.4
4.4
Permittivity
8
13
Bandgap (eV)
2.7
0
Doping concentration ()
, n-type
, p-type
Electron mobility []
20
20,000
Hole mobility []
10
10,000
Conduction band effective DOS NC ()
Valence band effective DOS NV ()
The phase differences () of the three samples with and without proteins were obtained for CCs ranging from 3.54 to , as shown in Figs. 8(a), 8(b), and 8(c), respectively. It is worth noting that the dependence of on frequency is quasi-linear. The higher the frequency and concentration, the larger the phase difference, as shown in Figs. 8(d)–8(f) of the 3D phase diagram. These results reveal that the phase is also altered after the introduction of protein, mainly because of the change in conductivity of , graphene, and HTJ. Therefore, can be considered a biosensing index for the three samples. Furthermore, the MS@HTJ sample has the largest of the three, measuring 327° at . As the CC increases, the shows an obvious change.
For the MS@Gr sample, does not change significantly as the CC increases; the maximum achievable value is 159°. Although the of the MS@CN sample increases as the CC increases, the overall is small and the maximum value is 116°. When is used as a dimension of sensing, the sensing effect of the HTJ is the best. Therefore, our claim that the phase change of the MS@HTJ sample is mainly caused by the HTJ has been verified.
The results show that the proposed three samples can function as a multi-dimensional THz biosensor capable of detecting , , and in the presence of proteins.
4. CONCLUSION
In this study, three novel terahertz biosensors are designed, fabricated, characterized, and comparatively analyzed. The three biosensors include , graphene, and an HTJ integrated with a dipole-resonant metasurface. As a result, the proposed THz biosensors are demonstrated for ultrasensitive, multi-dimensional sensing of casein molecules with a limit of detection of 3.54 ng/mL by identifying the changes in frequency, phase, and amplitude. When the casein concentration reaches its highest value (), the frequency shift and phase differences reach their maximum values, which are up to 251 GHz and 327° for the HTJ biosensors. We presented simulation calculations and a theoretical analysis of changes in the conductivity of the active layer via electrostatic doping effect to explain the internal mechanism of the biosensor. As casein concentration increases and the covalent bonding of graphitic carbon nitride, graphene, and HTJ strengthens, the energy band structure changes and the conductivity of the active layer changes. More importantly, the MS@HTJ sample showed the greatest response to the protein. To prove the advantages of the HTJ for the sensor, the Silvaco Atlas package was used to model the three samples’ energy band structure and carrier transport. The simulation results successfully verified the correctness of our proposed mechanism theory model. These findings are promising for designing ultrasensitive HTJ THz meta-sensors.
Acknowledgment
Acknowledgment. We thank OSA Language Editing Group for editing the English text of a draft of this paper.