• Photonics Research
  • Vol. 9, Issue 12, 2398 (2021)
Angela I. Barreda1、2、3, Mario Zapata-Herrera4、5, Isabelle M. Palstra6、7, Laura Mercadé3, Javier Aizpurua4、5, A. Femius Koenderink6、7, and Alejandro Martínez3、*
Author Affiliations
  • 1Institute of Solid State Physics, Friedrich Schiller University Jena, 07743 Jena, Germany
  • 2Institute of Applied Physics, Abbe Center of Photonics, Friedrich Schiller University Jena, 07745 Jena, Germany
  • 3Nanophotonics Technology Center, Universitat Politècnica de València, Camino de Vera s/n, 46022 Valencia, Spain
  • 4Materials Physics Center CSIC-UPV/EHU, 20018 Donostia-San Sebastian, Spain
  • 5Donostia International Physics Center DIPC, 20018 Donostia-San Sebastian, Spain
  • 6Center for Nanophotonics, AMOLF, 1098 XG Amsterdam, The Netherlands
  • 7Van der Waals-Zeeman Institute, Institute of Physics, University of Amsterdam, 1090 GL Amsterdam, The Netherlands
  • show less
    DOI: 10.1364/PRJ.433761 Cite this Article Set citation alerts
    Angela I. Barreda, Mario Zapata-Herrera, Isabelle M. Palstra, Laura Mercadé, Javier Aizpurua, A. Femius Koenderink, Alejandro Martínez. Hybrid photonic-plasmonic cavities based on the nanoparticle-on-a-mirror configuration[J]. Photonics Research, 2021, 9(12): 2398 Copy Citation Text show less
    Conceptual scheme of the hybrid system under study. (a) A metallic nanoparticle is placed on top of a dielectric cavity. Both structures are spaced by a tiny gap of thickness d, shown as an inset. The isolated systems are a (b) metallic nanoparticle, in this case a gold nanosphere, and (c) a photonic crystal cavity having a photonic bandgap for TM modes. (d) An intermediate system arises when the metal nanoparticle is placed on top of a nonstructured dielectric medium.
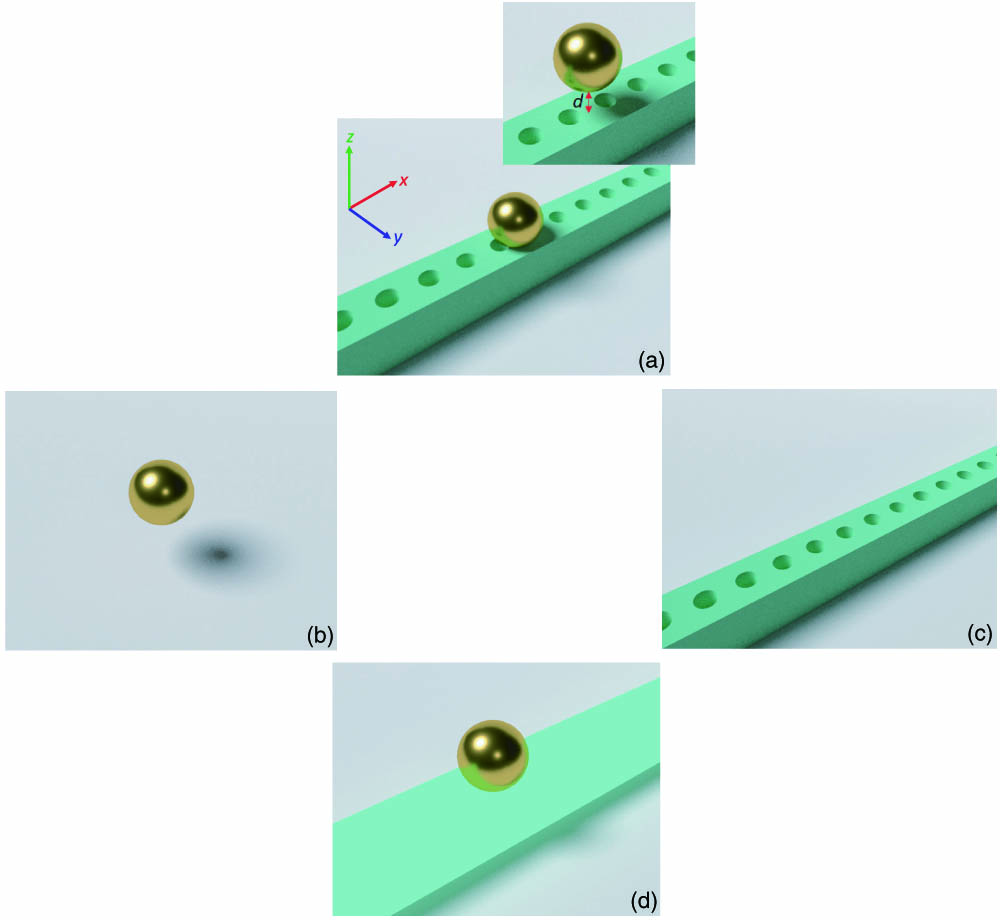
    Fig. 1. Conceptual scheme of the hybrid system under study. (a) A metallic nanoparticle is placed on top of a dielectric cavity. Both structures are spaced by a tiny gap of thickness d, shown as an inset. The isolated systems are a (b) metallic nanoparticle, in this case a gold nanosphere, and (c) a photonic crystal cavity having a photonic bandgap for TM modes. (d) An intermediate system arises when the metal nanoparticle is placed on top of a nonstructured dielectric medium.
    Simulation results of the different building blocks of the hybrid cavity. (a) Normalized LDOS, Q, and V and (b) mode profile (z-x crosscut) of the z component of the electric field normalized to its maximum value for a gold nanoparticle of radius R=40 nm; (c), (d) are like (a), (b) but for the dielectric gallium phosphide photonic crystal cavity described in the main text; (e), (f) are like (a), (b) but assuming that the nanosphere (R=40 nm) is placed on top of a nonstructured gallium phosphide dielectric slab (width w=200 nm and thickness t=250 nm).
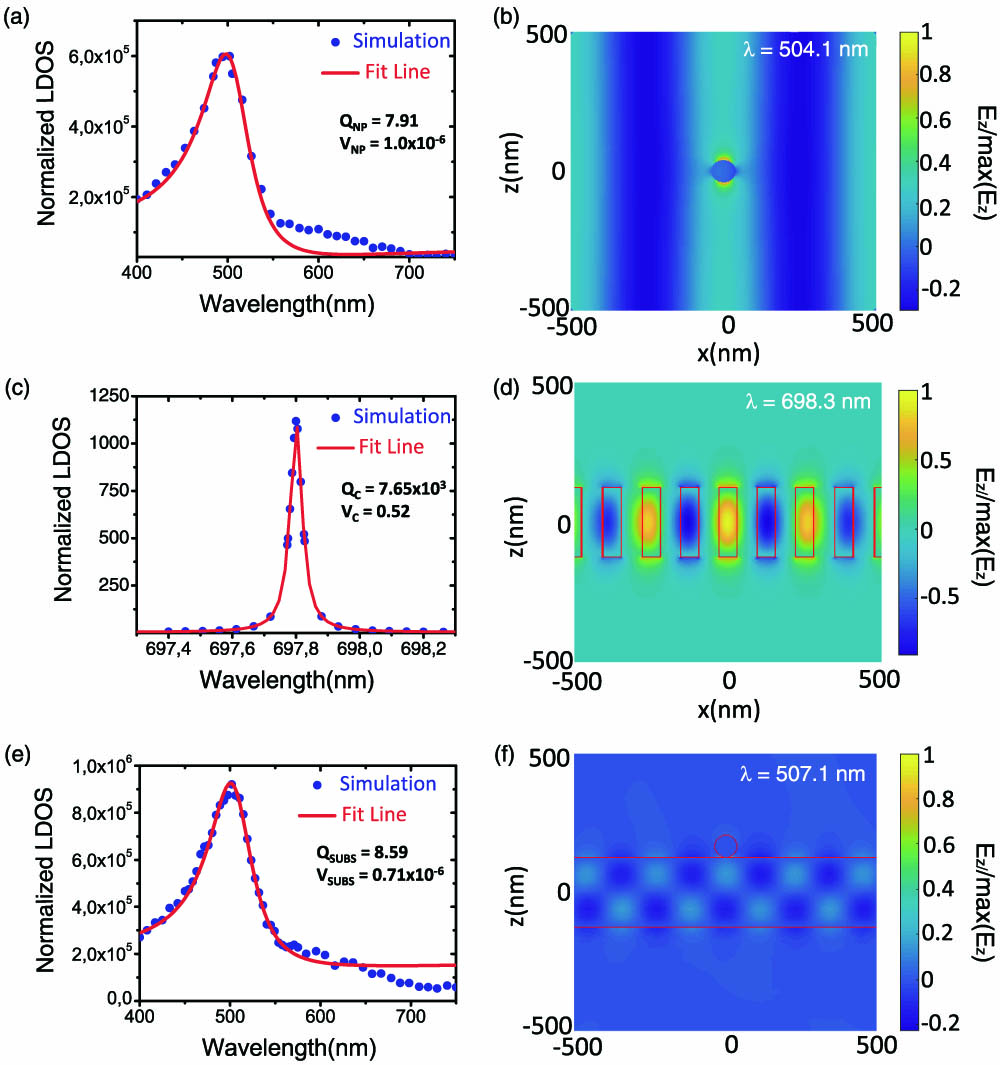
    Fig. 2. Simulation results of the different building blocks of the hybrid cavity. (a) Normalized LDOS, Q, and V and (b) mode profile (z-x crosscut) of the z component of the electric field normalized to its maximum value for a gold nanoparticle of radius R=40  nm; (c), (d) are like (a), (b) but for the dielectric gallium phosphide photonic crystal cavity described in the main text; (e), (f) are like (a), (b) but assuming that the nanosphere (R=40  nm) is placed on top of a nonstructured gallium phosphide dielectric slab (width w=200  nm and thickness t=250  nm).
    Simulation results of the hybrid cavity as a function of the gold nanosphere radius. (a) Normalized LDOS and (b) quality factor and normalized mode volume for the hybrid system constituted by the cavity beam and a gold nanoparticle of radius varying from R=30 to 70 nm. The sphere is separated from the cavity by a gap of d=1 nm. (c) Mode profile (z–x crosscut) of the z component of the electric field normalized to its maximum value. Note that the scale is saturated to improve visualization. The electric field amplitude in the gap (|Egap|) normalized to its maximum value is represented in the inset for an R=40 nm nanosphere-based hybrid cavity.
    Fig. 3. Simulation results of the hybrid cavity as a function of the gold nanosphere radius. (a) Normalized LDOS and (b) quality factor and normalized mode volume for the hybrid system constituted by the cavity beam and a gold nanoparticle of radius varying from R=30 to 70 nm. The sphere is separated from the cavity by a gap of d=1  nm. (c) Mode profile (zx crosscut) of the z component of the electric field normalized to its maximum value. Note that the scale is saturated to improve visualization. The electric field amplitude in the gap (|Egap|) normalized to its maximum value is represented in the inset for an R=40  nm nanosphere-based hybrid cavity.
    Simulation results of alternative configurations for the hybrid cavity. (a) Normalized LDOS, quality factor, and normalized mode volume and (b) mode profile (z-x crosscut) of the z component of the electric field normalized to its maximum value. Note that the scale is saturated to improve visualization. The electric field amplitude in the gap (|Egap|) normalized to its maximum value is represented in the inset for a nanocube-based hybrid cavity. The length side of the cube is l=75 nm. (c), (d) are like (a), (b) but for a nanoellipse-based hybrid cavity. The width and length of the ellipsoid are we=40 nm and le=70 nm, respectively.
    Fig. 4. Simulation results of alternative configurations for the hybrid cavity. (a) Normalized LDOS, quality factor, and normalized mode volume and (b) mode profile (z-x crosscut) of the z component of the electric field normalized to its maximum value. Note that the scale is saturated to improve visualization. The electric field amplitude in the gap (|Egap|) normalized to its maximum value is represented in the inset for a nanocube-based hybrid cavity. The length side of the cube is l=75  nm. (c), (d) are like (a), (b) but for a nanoellipse-based hybrid cavity. The width and length of the ellipsoid are we=40  nm and le=70  nm, respectively.
    Mode profiles of the electric field amplitude |E| corresponding to the x-y crosscut at the position of the dipole (0.5 nm above the cavity) normalized to their maximum values. The (a) bare cavity, (b) sphere, (c) ellipsoid, and (d) cube cases are shown. Note that the scale is saturated to improve visualization.
    Fig. 5. Mode profiles of the electric field amplitude |E| corresponding to the x-y crosscut at the position of the dipole (0.5 nm above the cavity) normalized to their maximum values. The (a) bare cavity, (b) sphere, (c) ellipsoid, and (d) cube cases are shown. Note that the scale is saturated to improve visualization.
    Comparison of the LDOS as a function of the wavelength for the three hybrid systems considered. The green line shows the results of the full-wave simulations (labeled FWS) discussed above. The blue curve shows the LDOS as calculated with Eq. (3) (labeled CHO for coupled oscillator model). The resonance frequency of the cavity in absence of the nanoparticle is indicated as λc (dashed vertical lines). The full-wave simulations have been scaled as indicated.
    Fig. 6. Comparison of the LDOS as a function of the wavelength for the three hybrid systems considered. The green line shows the results of the full-wave simulations (labeled FWS) discussed above. The blue curve shows the LDOS as calculated with Eq. (3) (labeled CHO for coupled oscillator model). The resonance frequency of the cavity in absence of the nanoparticle is indicated as λc (dashed vertical lines). The full-wave simulations have been scaled as indicated.
    Quality factors Q and normalized effective mode volumes V for bare metallic nanoparticles (asterisks of different colors according to the nanoparticle geometry: sphere, yellow; ellipsoid, red; and cube, magenta), the photonic crystal nanobeam cavity (circle), the spherical nanoparticle (R=40 nm) on a nonstructured gallium phosphide substrate (diamond), and the hybrids (triangles of different colors according to the geometry of the nanoparticle on the cavity: sphere, yellow; ellipsoid, red; and cube, magenta). The dimensions for the different nanoparticles are: sphere (R=40 nm), ellipsoid (we=40 nm and le=70 nm), and cube (l=75 nm). Diagonal dashed lines are lines of constant Purcell factor with value FP as labeled.
    Fig. 7. Quality factors Q and normalized effective mode volumes V for bare metallic nanoparticles (asterisks of different colors according to the nanoparticle geometry: sphere, yellow; ellipsoid, red; and cube, magenta), the photonic crystal nanobeam cavity (circle), the spherical nanoparticle (R=40  nm) on a nonstructured gallium phosphide substrate (diamond), and the hybrids (triangles of different colors according to the geometry of the nanoparticle on the cavity: sphere, yellow; ellipsoid, red; and cube, magenta). The dimensions for the different nanoparticles are: sphere (R=40  nm), ellipsoid (we=40  nm and le=70  nm), and cube (l=75  nm). Diagonal dashed lines are lines of constant Purcell factor with value FP as labeled.
    Scheme of the proposed photonic crystal cavity. In (a) and (b), 3D and 2D (x-y plane) views are shown.
    Fig. 8. Scheme of the proposed photonic crystal cavity. In (a) and (b), 3D and 2D (x-y plane) views are shown.
    Scheme of the hybrid cavity: gold NP—in this case, a nanosphere—on a photonic crystal cavity. (a) and (b) A 3D view and a 2D cut (z-x plane) of the geometry, respectively.
    Fig. 9. Scheme of the hybrid cavity: gold NP—in this case, a nanosphere—on a photonic crystal cavity. (a) and (b) A 3D view and a 2D cut (z-x plane) of the geometry, respectively.
    z-x cut of the geometry simulated with COMSOL, showing the hybrid cavity at the center. The structure is embedded in an air cylindrical region. This air region is surrounded by a PML.
    Fig. 10. z-x cut of the geometry simulated with COMSOL, showing the hybrid cavity at the center. The structure is embedded in an air cylindrical region. This air region is surrounded by a PML.
    Detail of the z-x cut of the geometry simulated with COMSOL. (a) Graphical representation of the gold NP, the nanobeam boundary, and the electric dipole source. In (b) we show a zoom of the gap between the NP and the cavity, where the dipolar source is placed. The small air sphere surrounding the dipole—used to achieve the convergence of the results—is also plotted.
    Fig. 11. Detail of the z-x cut of the geometry simulated with COMSOL. (a) Graphical representation of the gold NP, the nanobeam boundary, and the electric dipole source. In (b) we show a zoom of the gap between the NP and the cavity, where the dipolar source is placed. The small air sphere surrounding the dipole—used to achieve the convergence of the results—is also plotted.
    Scheme of the geometry used in COMSOL to calculate the radiative power. (a) z-x plane. (b) z-y plane. (c) x-y plane.
    Fig. 12. Scheme of the geometry used in COMSOL to calculate the radiative power. (a) z-x plane. (b) z-y plane. (c) x-y plane.
    Scheme of the model used to perform the simulations corresponding to the absorption, scattering, and extinction cross sections of bare gold NPs. In (a), the PML and the air medium surrounding the NP can be observed. In (b), we have represented a 2D cut of the 3D view in (a), where the NP is also visible.
    Fig. 13. Scheme of the model used to perform the simulations corresponding to the absorption, scattering, and extinction cross sections of bare gold NPs. In (a), the PML and the air medium surrounding the NP can be observed. In (b), we have represented a 2D cut of the 3D view in (a), where the NP is also visible.
    (a) Radiative LDOS for different radii of the sphere surrounding the dipole (r=0.2–0.4 nm) for a nanosphere-based hybrid cavity (radius of the nanosphere R=40 nm). (b) Normalized LDOS calculated by the methods (1) and (2) described above for a nanosphere-based hybrid cavity (radius of the nanosphere R=40 nm).
    Fig. 14. (a) Radiative LDOS for different radii of the sphere surrounding the dipole (r=0.20.4  nm) for a nanosphere-based hybrid cavity (radius of the nanosphere R=40  nm). (b) Normalized LDOS calculated by the methods (1) and (2) described above for a nanosphere-based hybrid cavity (radius of the nanosphere R=40  nm).
    Absorption and scattering cross sections’ spectra for a nanosphere of radius R=40 nm obtained numerically, with COMSOL, and analytically, by means of the Mie theory.
    Fig. 15. Absorption and scattering cross sections’ spectra for a nanosphere of radius R=40  nm obtained numerically, with COMSOL, and analytically, by means of the Mie theory.
    (a) Photonic band diagram of the mirror unit cell for the TM modes with even and odd z symmetries. (b) (Left) Close view of the even symmetric modes and (right) evolution of the confined band at the X symmetry point from the mirror unit cell to the defect unit cell.
    Fig. 16. (a) Photonic band diagram of the mirror unit cell for the TM modes with even and odd z symmetries. (b) (Left) Close view of the even symmetric modes and (right) evolution of the confined band at the X symmetry point from the mirror unit cell to the defect unit cell.
    (a) Normalized LDOS and (b) Q factor and V for the bare nanosphere as a function of the radius (R ranging from 30 to 70 nm). The normalized LDOS for the nanocube (l=75 nm) and nanoellipsoid (we=40 nm and le=70 nm) is represented in (c) and (d), respectively. As insets, the Q factor and V values are provided.
    Fig. 17. (a) Normalized LDOS and (b) Q factor and V for the bare nanosphere as a function of the radius (R ranging from 30 to 70 nm). The normalized LDOS for the nanocube (l=75  nm) and nanoellipsoid (we=40  nm and le=70  nm) is represented in (c) and (d), respectively. As insets, the Q factor and V values are provided.
    Radiative and nonradiative contributions to the normalized LDOS for the (a) nanosphere-based (R=40 nm), (c) nanocube-based (l=75 nm), and (e) nanoellipsoid-based hybrid cavities (we=40 nm and le=70 nm). In (b), (d), and (f) the ratio radiative/nonradiative LDOS is represented for the same configurations as in (a), (c), and (e).
    Fig. 18. Radiative and nonradiative contributions to the normalized LDOS for the (a) nanosphere-based (R=40  nm), (c) nanocube-based (l=75  nm), and (e) nanoellipsoid-based hybrid cavities (we=40  nm and le=70  nm). In (b), (d), and (f) the ratio radiative/nonradiative LDOS is represented for the same configurations as in (a), (c), and (e).
    Radiative contribution to the (a) normalized LDOS and (b) ratio of radiative/nonradiative LDOS for different radii of the nanosphere-based hybrid cavity (R=[30−70] nm).
    Fig. 19. Radiative contribution to the (a) normalized LDOS and (b) ratio of radiative/nonradiative LDOS for different radii of the nanosphere-based hybrid cavity (R=[3070]  nm).
    Normalized LDOS, Q factor, and V for (a) nanosphere-based (radius R=40 nm), (b) nanocube-based (side length of the nanocube l=75 nm), and (c) nanoellipsoid-based hybrid cavity (the width and length of the ellipsoid are we=40 nm and le=70 nm, respectively). Only the radiative contribution has been considered. (d) Q and V for the hybrids considering the total LDOS (radiative+nonradiative contributions) (triangles) or only the radiative LDOS (circles) for different geometries of nanoparticles (sphere, yellow; ellipsoid, red; and cube, magenta). Diagonal dashed lines represent constant Purcell factor with value FP as labeled.
    Fig. 20. Normalized LDOS, Q factor, and V for (a) nanosphere-based (radius R=40  nm), (b) nanocube-based (side length of the nanocube l=75  nm), and (c) nanoellipsoid-based hybrid cavity (the width and length of the ellipsoid are we=40  nm and le=70  nm, respectively). Only the radiative contribution has been considered. (d) Q and V for the hybrids considering the total LDOS (radiative+nonradiative contributions) (triangles) or only the radiative LDOS (circles) for different geometries of nanoparticles (sphere, yellow; ellipsoid, red; and cube, magenta). Diagonal dashed lines represent constant Purcell factor with value FP as labeled.
    Radiative contribution to the normalized LDOS for the (a) nanosphere (R=40 nm), (c) nanocube (l=75 nm), and (e) nanoellipsoid (we=40 nm and le=70 nm). (b), (d), and (f) Nonradiative contribution to LDOS for the same configurations as in (a), (c), and (e).
    Fig. 21. Radiative contribution to the normalized LDOS for the (a) nanosphere (R=40  nm), (c) nanocube (l=75  nm), and (e) nanoellipsoid (we=40  nm and le=70  nm). (b), (d), and (f) Nonradiative contribution to LDOS for the same configurations as in (a), (c), and (e).
    Absorption, scattering, and extinction cross sections (CS) for the (a) nanosphere (R=40 nm), (c) nanocube (l=75 nm), and (e) nanoellipsoid (we=40 nm and le=70 nm). (b), (d), and (f) Multipolar decomposition corresponding to the scattering cross sections (SCS) for the same configurations as in (a), (c), and (e). The NPs are illuminated by a plane wave linearly polarized along the z axis and propagating along the x axis (see Fig. 1 for axis orientation).
    Fig. 22. Absorption, scattering, and extinction cross sections (CS) for the (a) nanosphere (R=40  nm), (c) nanocube (l=75  nm), and (e) nanoellipsoid (we=40  nm and le=70  nm). (b), (d), and (f) Multipolar decomposition corresponding to the scattering cross sections (SCS) for the same configurations as in (a), (c), and (e). The NPs are illuminated by a plane wave linearly polarized along the z axis and propagating along the x axis (see Fig. 1 for axis orientation).
    Angela I. Barreda, Mario Zapata-Herrera, Isabelle M. Palstra, Laura Mercadé, Javier Aizpurua, A. Femius Koenderink, Alejandro Martínez. Hybrid photonic-plasmonic cavities based on the nanoparticle-on-a-mirror configuration[J]. Photonics Research, 2021, 9(12): 2398
    Download Citation