• Acta Optica Sinica
  • Vol. 38, Issue 12, 1215001 (2018)
Chengwei Mo1、*, Haihua Cui1、*, Xiaosheng Cheng1, and Haibin Yao2
Author Affiliations
  • 1 College of Electrical and Mechanical, Nanjing University of Aeronautics and Astronautics, Nanjing, Jiangsu 210016, China
  • 2 Yangzhou Polytechnic College, Yangzhou, Jiangsu 225009, China
  • show less
    DOI: 10.3788/AOS201838.1215001 Cite this Article Set citation alerts
    Chengwei Mo, Haihua Cui, Xiaosheng Cheng, Haibin Yao. Cross-Scale Registration Method Based on Fractal Dimension Characterization[J]. Acta Optica Sinica, 2018, 38(12): 1215001 Copy Citation Text show less
    Cross-scale data obtained by different measurement configures
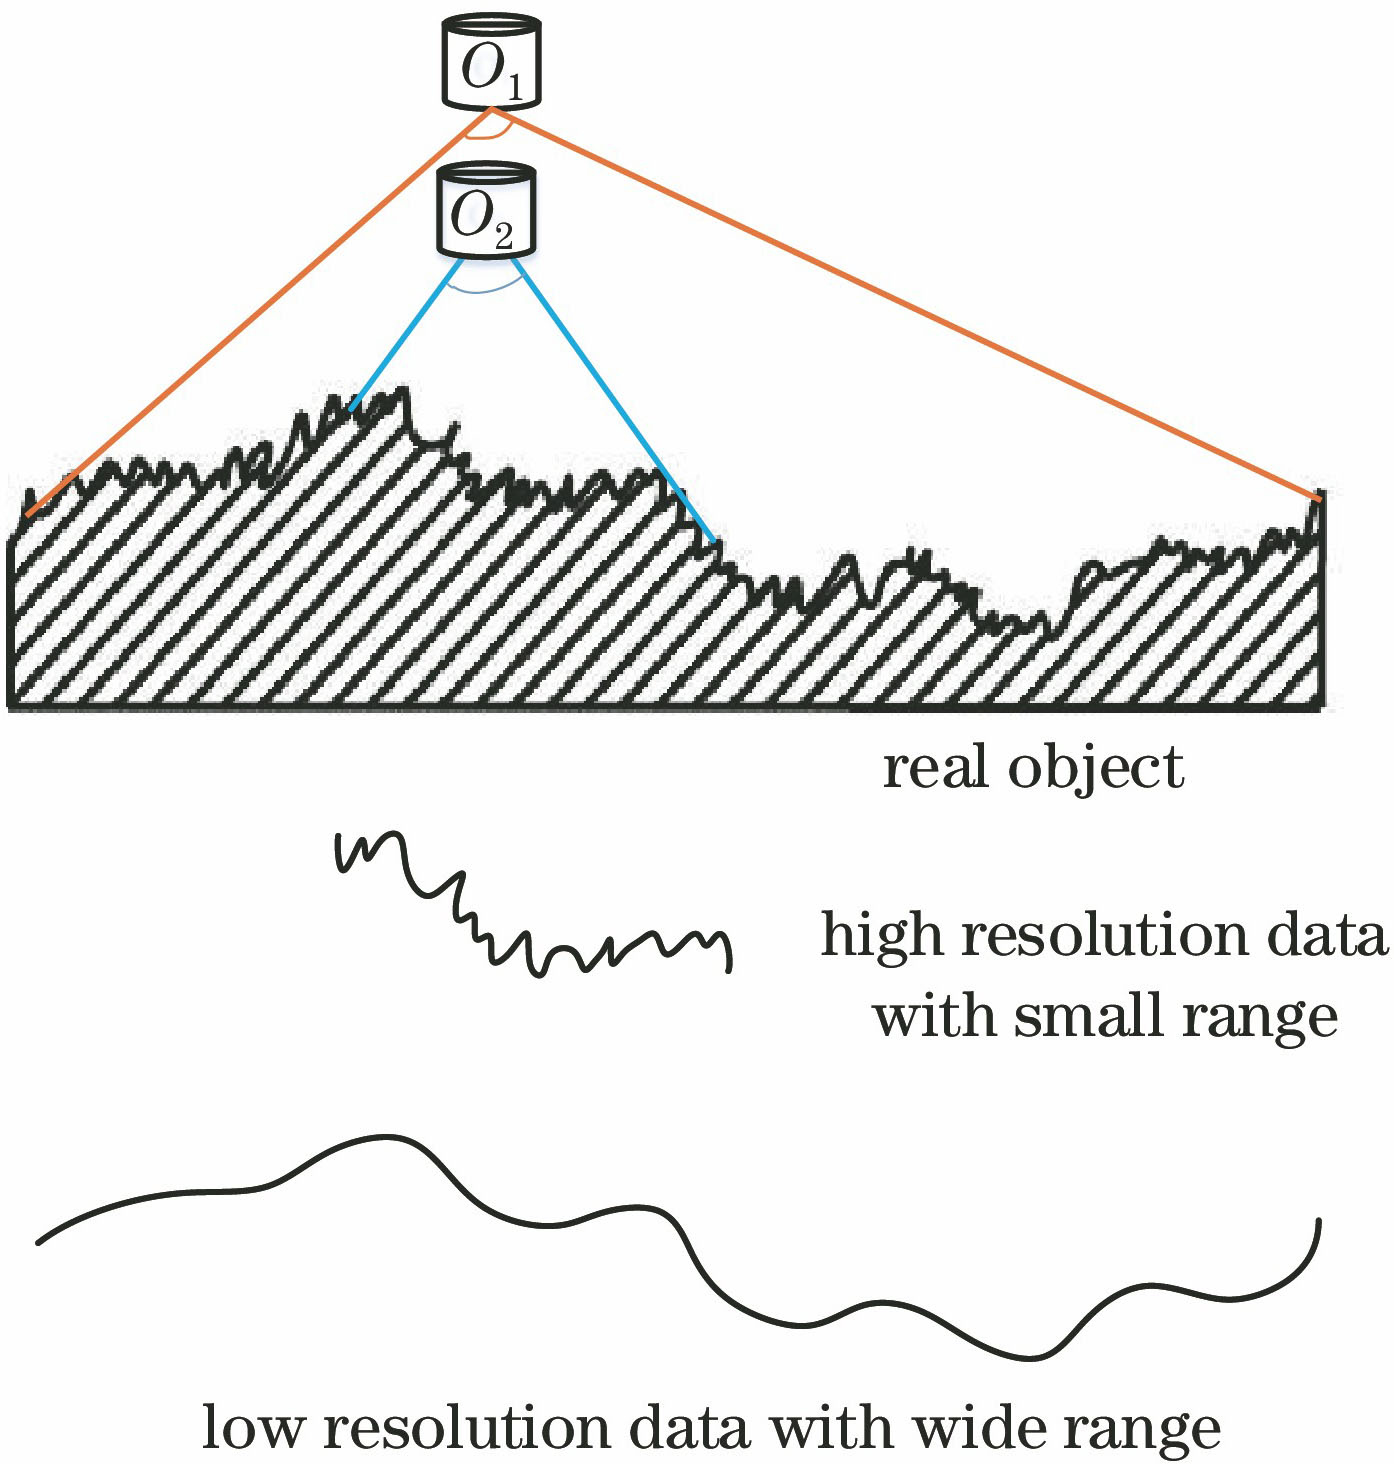
    Fig. 1. Cross-scale data obtained by different measurement configures
    Multilevel wavelet transform space
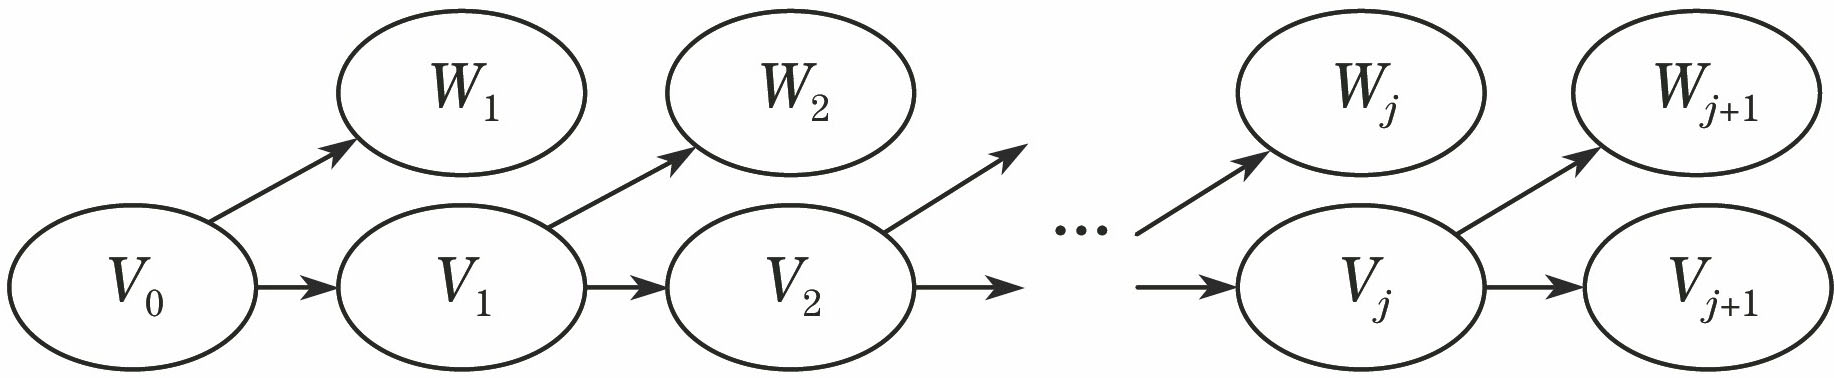
    Fig. 2. Multilevel wavelet transform space
    Process of two-dimensional discrete wavelet transform
    Fig. 3. Process of two-dimensional discrete wavelet transform
    Flowchart of ICP algorithm
    Fig. 4. Flowchart of ICP algorithm
    Surface texture of cutting tool
    Fig. 5. Surface texture of cutting tool
    Three-dimensional topographical data at different magnifications. (a) 20×; (b) 50×; (c) 100×
    Fig. 6. Three-dimensional topographical data at different magnifications. (a) 20×; (b) 50×; (c) 100×
    (a) Raw data; three-dimensional data after DWT at (b) level 3 and (c) level 5
    Fig. 7. (a) Raw data; three-dimensional data after DWT at (b) level 3 and (c) level 5
    Two-dimensional contour of different levels at the same position of DWT data. (a) Level 0; (b) level 1; (c) level 2; (d) level 3; (e) level 4; (f) level 5
    Fig. 8. Two-dimensional contour of different levels at the same position of DWT data. (a) Level 0; (b) level 1; (c) level 2; (d) level 3; (e) level 4; (f) level 5
    Logarithmic graph of (a) raw data at magnification of 100× and data after DWT at (b) level 3 and (c) level 5
    Fig. 9. Logarithmic graph of (a) raw data at magnification of 100× and data after DWT at (b) level 3 and (c) level 5
    Logarithmic graph of raw data at different magnifications. (a) 20×; (b) 50×; (c) 100×
    Fig. 10. Logarithmic graph of raw data at different magnifications. (a) 20×; (b) 50×; (c) 100×
    (a) Registration results of scale-approximated data of level 3 wavelet approximation of 100× small scale data and 20× data; (b) apply the transform matrix on raw data; (c)(d) corresponding local magnification diagram
    Fig. 11. (a) Registration results of scale-approximated data of level 3 wavelet approximation of 100× small scale data and 20× data; (b) apply the transform matrix on raw data; (c)(d) corresponding local magnification diagram
    (a) Two-dimensional contour of registration result of scale-approximated data; (b) two-dimensional contour of raw data after applying transform matrix
    Fig. 12. (a) Two-dimensional contour of registration result of scale-approximated data; (b) two-dimensional contour of raw data after applying transform matrix
    LevelFractal dimension
    Raw data (0)2.42649
    12.35152
    22.30153
    32.24905
    42.23375
    52.19663
    Table 1. Fractal dimension of data after DWT at different levels
    MagnificationFractal dimension
    20×2.24281
    50×2.39668
    100×2.42649
    Table 2. Fractal dimensions of raw data at different magnifications
    Chengwei Mo, Haihua Cui, Xiaosheng Cheng, Haibin Yao. Cross-Scale Registration Method Based on Fractal Dimension Characterization[J]. Acta Optica Sinica, 2018, 38(12): 1215001
    Download Citation