• Photonics Research
  • Vol. 10, Issue 2, 465 (2022)
Pan Wang1, Jiangyong He1, Xiaosheng Xiao2, Zhi Wang1、3、*, and Yange Liu1、4、*
Author Affiliations
  • 1Institute of Modern Optics, Nankai University, Tianjin Key Laboratory of Micro-scale Optical Information Science and Technology, Tianjin 300350, China
  • 2School of Electronic Engineering, State Key Laboratory of Information Photonics and Optical Communications, Beijing University of Posts and Telecommunications, Beijing 100876, China
  • 3e-mail: zhiwang@nankai.edu.cn
  • 4e-mail: ygliu@nankai.edu.cn
  • show less
    DOI: 10.1364/PRJ.442615 Cite this Article Set citation alerts
    Pan Wang, Jiangyong He, Xiaosheng Xiao, Zhi Wang, Yange Liu. Sub-terahertz-repetition-rate frequency comb generated by filter-induced instabilities in passive driven fiber resonators[J]. Photonics Research, 2022, 10(2): 465 Copy Citation Text show less
    (A) Schematic diagram of the passive driven resonator configuration. IM, intensity modulator; EDFA, erbium-doped fiber amplifier; ISO, isolator; PD, photodiode; PID, proportional-integral-derivative; Filter1, longer-wavelength super-Gaussian spectral filter; Filter2, shorter-wavelength super-Gaussian spectral filter; VODL, variable optical delay line; SMF, single-mode fiber; DCF, dispersion compensation fiber. (B) Functions of the offset spectral filters.
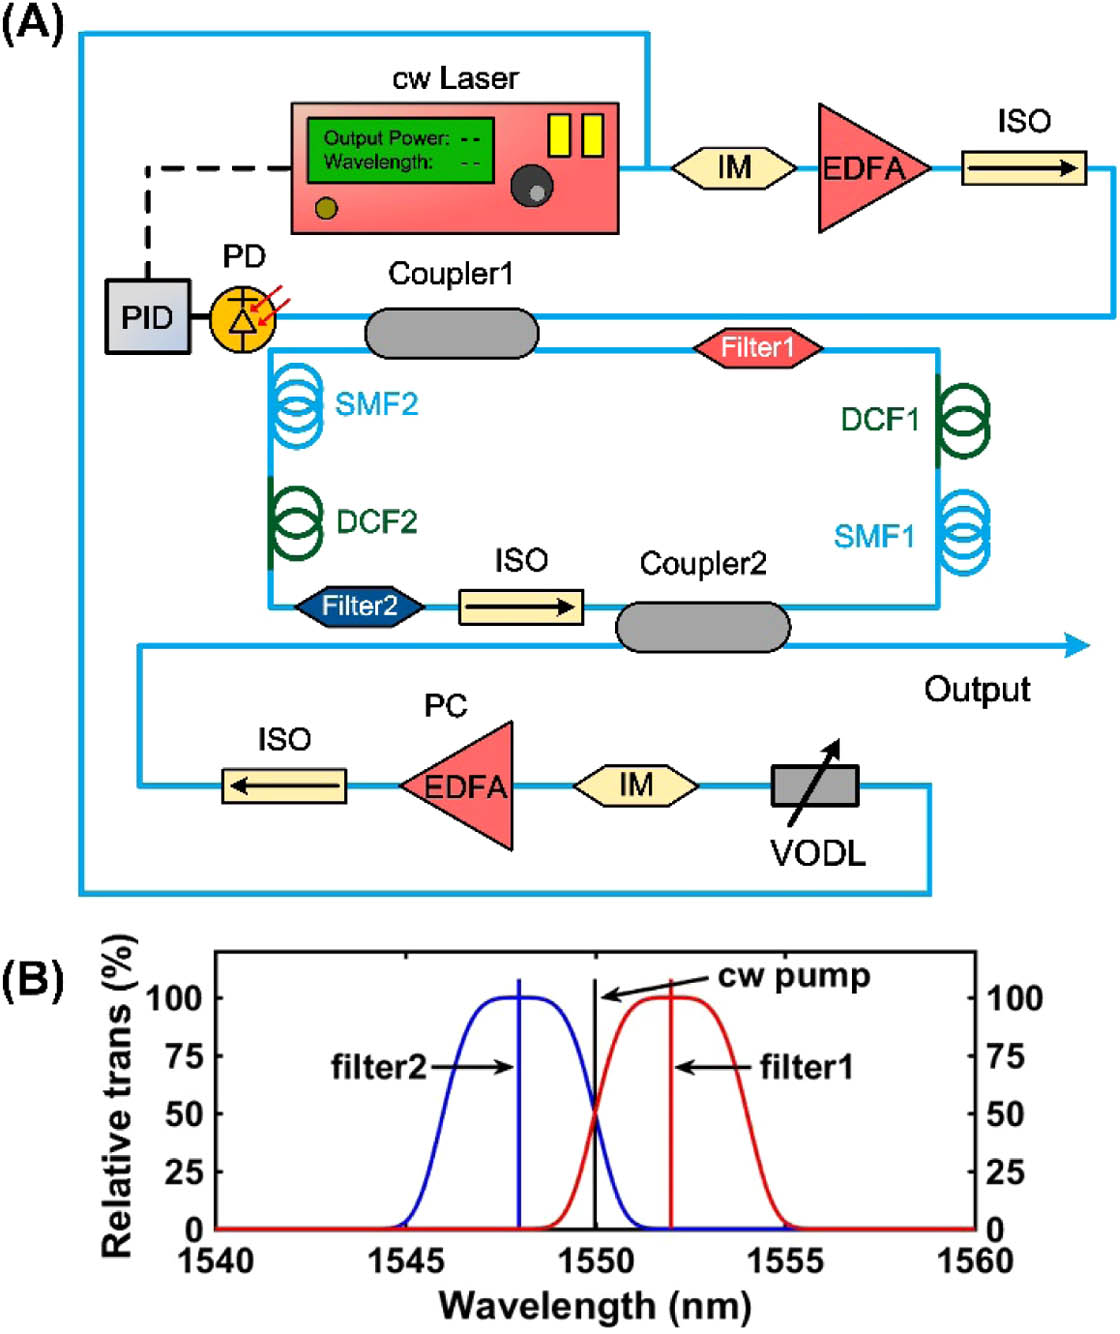
    Fig. 1. (A) Schematic diagram of the passive driven resonator configuration. IM, intensity modulator; EDFA, erbium-doped fiber amplifier; ISO, isolator; PD, photodiode; PID, proportional-integral-derivative; Filter1, longer-wavelength super-Gaussian spectral filter; Filter2, shorter-wavelength super-Gaussian spectral filter; VODL, variable optical delay line; SMF, single-mode fiber; DCF, dispersion compensation fiber. (B) Functions of the offset spectral filters.
    Floquet linear stability analysis in the all-normal dispersion regime. (A) Floquet spectrum as a function of the pump; (B) Floquet spectrum as a function of frequency detuning of filters; (C) Floquet spectrum calculated with parameters of ΔΩ=2 nm, EIN=7.0, and δ0=1.3 rad; (D) Floquet spectrum as a function of the modulation period Tf. (E) Evolution of the absolute values of the amplitudes of the most unstable modes a(+Ω) and a(−Ω) (blue and red lines, respectively). The losses are introduced at points F1, F2, etc., in time. (F) Dynamics of the complex amplitude a(+Ω) of the most unstable mode calculated by direct integration of the Ikeda map. The adjacent half-cavity periods, after the longer or shorter-wavelength spectral filters, are represented by different colors of blue and red, respectively. The direction of temporal evolution is indicated by arrows.
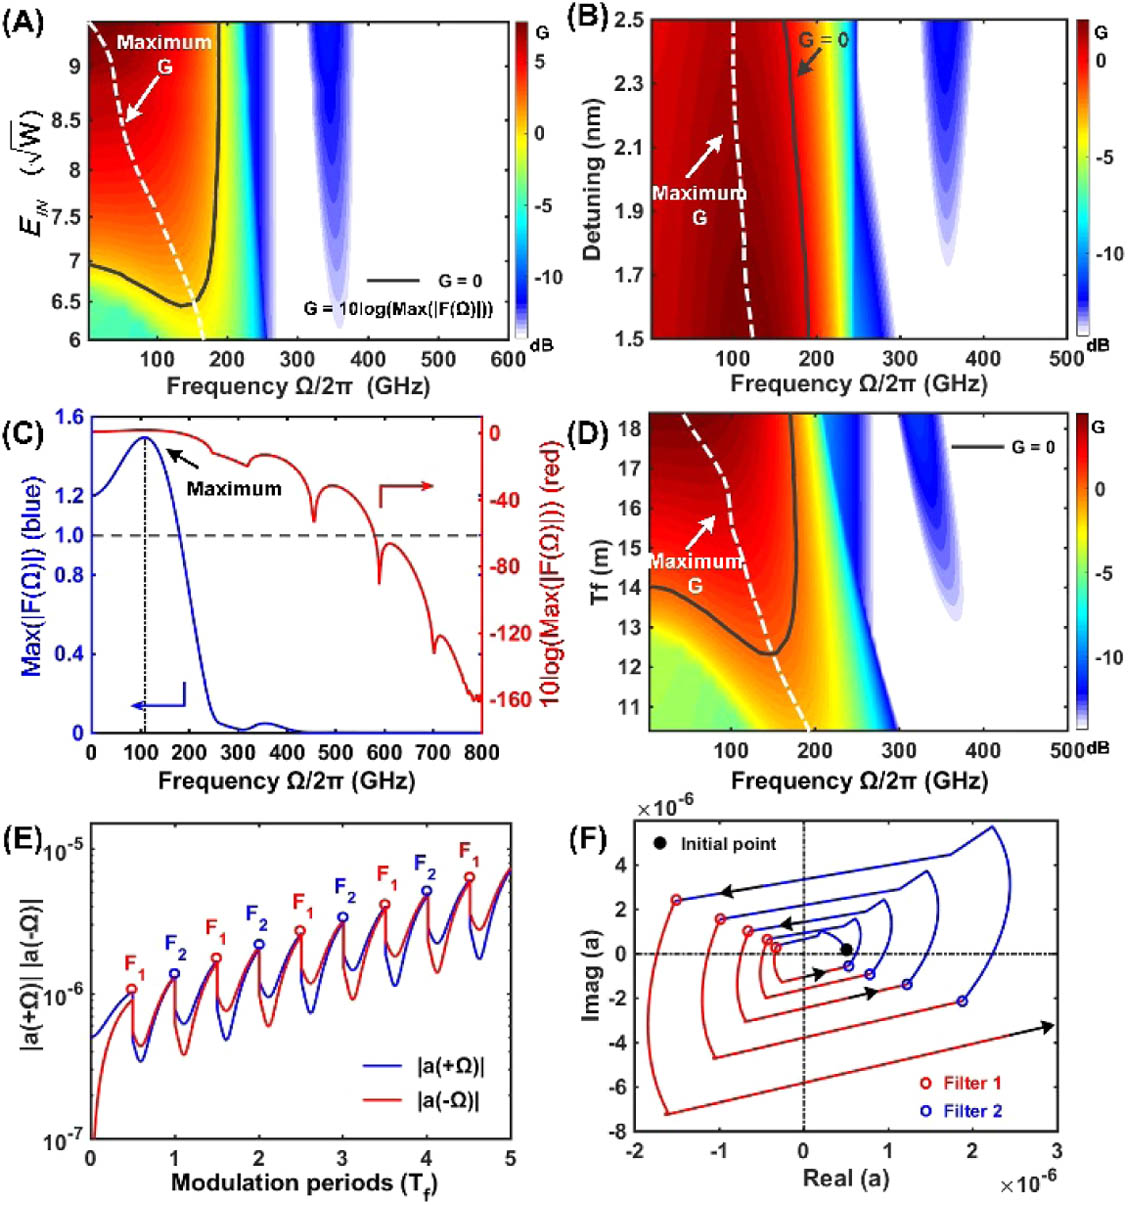
    Fig. 2. Floquet linear stability analysis in the all-normal dispersion regime. (A) Floquet spectrum as a function of the pump; (B) Floquet spectrum as a function of frequency detuning of filters; (C) Floquet spectrum calculated with parameters of ΔΩ=2  nm, EIN=7.0, and δ0=1.3  rad; (D) Floquet spectrum as a function of the modulation period Tf. (E) Evolution of the absolute values of the amplitudes of the most unstable modes a(+Ω) and a(Ω) (blue and red lines, respectively). The losses are introduced at points F1, F2, etc., in time. (F) Dynamics of the complex amplitude a(+Ω) of the most unstable mode calculated by direct integration of the Ikeda map. The adjacent half-cavity periods, after the longer or shorter-wavelength spectral filters, are represented by different colors of blue and red, respectively. The direction of temporal evolution is indicated by arrows.
    Spatiotemporal dynamics of pattern formation in the all-normal dispersion regime: (A) temporal and (C) spectral evolution over 200 round trips at the output of Coupler2; (B) temporal and (D) spectral evolution during per cavity round trip. A, B, C, and D represent the DCF1, filter1 + Coupler1, DCF2, filter2 + Coupler2. The remaining parameters are ΔΩ=2 nm, EIN=7.0, and δ0=1.3 rad.
    Fig. 3. Spatiotemporal dynamics of pattern formation in the all-normal dispersion regime: (A) temporal and (C) spectral evolution over 200 round trips at the output of Coupler2; (B) temporal and (D) spectral evolution during per cavity round trip. A, B, C, and D represent the DCF1, filter1 + Coupler1, DCF2, filter2 + Coupler2. The remaining parameters are ΔΩ=2  nm, EIN=7.0, and δ0=1.3  rad.
    Spatiotemporal profiles of pattern formation in the all-normal dispersion regime: (A) before and (B) after the interaction with the shorter-wavelength filter; (C) pulse train temporal and phase profiles after the shorter-wavelength filter; (D) spectral profile after the shorter-wavelength filter.
    Fig. 4. Spatiotemporal profiles of pattern formation in the all-normal dispersion regime: (A) before and (B) after the interaction with the shorter-wavelength filter; (C) pulse train temporal and phase profiles after the shorter-wavelength filter; (D) spectral profile after the shorter-wavelength filter.
    Floquet linear stability analysis in dispersion-managed regimes: (A) Floquet spectrum and (B) temporal evolution over 200 round trips after Coupler2, calculated with parameters of LSMF1=LSMF2=6.0 m, LDCF1=LDCF2=7.2 m, ΔΩ=2 nm, EIN=6.4, δ0=1.3 rad, and total GVD=+1.89 ps2; (C) Floquet spectrum and (D) temporal evolution over 200 round trips after Coupler2, calculated with parameters of LSMF1=LSMF2=6.0 m, LDCF1=LDCF2=1.0 m, ΔΩ=3.4 nm, EIN=8.8, δ0=2.0 rad, and total GVD=+0.026 ps2; (E) Floquet spectrum and (F) temporal evolution over 200 round trips after Coupler2, calculated with parameters of LSMF1=LSMF2=5.0 m, LDCF1=LDCF2=0.4 m, ΔΩ=2.8 nm, EIN=8.6, δ0=1.6 rad, and total GVD=−0.109 ps2.
    Fig. 5. Floquet linear stability analysis in dispersion-managed regimes: (A) Floquet spectrum and (B) temporal evolution over 200 round trips after Coupler2, calculated with parameters of LSMF1=LSMF2=6.0  m, LDCF1=LDCF2=7.2  m, ΔΩ=2  nm, EIN=6.4, δ0=1.3  rad, and total GVD=+1.89  ps2; (C) Floquet spectrum and (D) temporal evolution over 200 round trips after Coupler2, calculated with parameters of LSMF1=LSMF2=6.0  m, LDCF1=LDCF2=1.0  m, ΔΩ=3.4  nm, EIN=8.8, δ0=2.0  rad, and total GVD=+0.026  ps2; (E) Floquet spectrum and (F) temporal evolution over 200 round trips after Coupler2, calculated with parameters of LSMF1=LSMF2=5.0  m, LDCF1=LDCF2=0.4  m, ΔΩ=2.8  nm, EIN=8.6, δ0=1.6  rad, and total GVD=0.109  ps2.
    Dynamics of complex amplitude of the most unstable mode and Floquet spectrum in dispersion-managed regimes: (A) perturbation evolution calculated with parameters as in Fig. 5(A); (B) Floquet spectrum as a function of the pump; (C) perturbation evolution calculated with parameters as in Fig. 5(C); (D) Floquet spectrum as a function of the pump; (E) perturbation evolution calculated with parameters as in Fig. 5(E); (F) Floquet spectrum as a function of the pump. The adjacent half-cavity periods, after the longer- or shorter-wavelength spectral filters, are represented by different colors of blue and red, respectively. The direction of temporal evolution is indicated by arrows.
    Fig. 6. Dynamics of complex amplitude of the most unstable mode and Floquet spectrum in dispersion-managed regimes: (A) perturbation evolution calculated with parameters as in Fig. 5(A); (B) Floquet spectrum as a function of the pump; (C) perturbation evolution calculated with parameters as in Fig. 5(C); (D) Floquet spectrum as a function of the pump; (E) perturbation evolution calculated with parameters as in Fig. 5(E); (F) Floquet spectrum as a function of the pump. The adjacent half-cavity periods, after the longer- or shorter-wavelength spectral filters, are represented by different colors of blue and red, respectively. The direction of temporal evolution is indicated by arrows.
    Floquet linear stability analysis in the all-anomalous dispersion regime. (A) Floquet spectrum as a function of the pump; (B) Floquet spectrum as a function of frequency detuning of filters; (C) Floquet spectrum calculated with parameters of LSMF1=LSMF2=20.0 m, ΔΩ=4.8 nm, EIN=6.6, δ0=1.8 rad, and total GVD=−0.916 ps2; (D) Floquet spectrum as a function of the modulation period Tf. (E) Evolution of the absolute values of the amplitude of the most unstable modes a(+Ω) and a(−Ω) (blue and red lines, respectively). The losses are introduced at points F1, F2, etc., in time. (F) Dynamics of the complex amplitude a(+Ω) calculated by direct integration of the Ikeda map. The direction of temporal evolution is indicated by arrows.
    Fig. 7. Floquet linear stability analysis in the all-anomalous dispersion regime. (A) Floquet spectrum as a function of the pump; (B) Floquet spectrum as a function of frequency detuning of filters; (C) Floquet spectrum calculated with parameters of LSMF1=LSMF2=20.0  m, ΔΩ=4.8  nm, EIN=6.6, δ0=1.8  rad, and total GVD=0.916  ps2; (D) Floquet spectrum as a function of the modulation period Tf. (E) Evolution of the absolute values of the amplitude of the most unstable modes a(+Ω) and a(Ω) (blue and red lines, respectively). The losses are introduced at points F1, F2, etc., in time. (F) Dynamics of the complex amplitude a(+Ω) calculated by direct integration of the Ikeda map. The direction of temporal evolution is indicated by arrows.
    Spatiotemporal dynamics of pattern formation in the all-anomalous dispersion regime. (A) temporal and (C) spectral evolution over 200 round trips at the output of Coupler2. (B) Temporal and (D) spectral evolution during per cavity round trip. A, B, C, and D represent the DCF1, filter1 + Coupler1, DCF2, and filter2 + Coupler2. The remaining parameters are LSMF1=LSMF2=20.0 m, ΔΩ=4.8 nm, EIN=6.6, and δ0=1.8 rad.
    Fig. 8. Spatiotemporal dynamics of pattern formation in the all-anomalous dispersion regime. (A) temporal and (C) spectral evolution over 200 round trips at the output of Coupler2. (B) Temporal and (D) spectral evolution during per cavity round trip. A, B, C, and D represent the DCF1, filter1 + Coupler1, DCF2, and filter2 + Coupler2. The remaining parameters are LSMF1=LSMF2=20.0  m, ΔΩ=4.8  nm, EIN=6.6, and δ0=1.8  rad.
    (A) Schematic diagram of the simplified passive driven resonator configuration. Only one shorter-wavelength super-Gaussian spectral filter is adopted for generation of GLI. (B) Functions of the offset spectral filter.
    Fig. 9. (A) Schematic diagram of the simplified passive driven resonator configuration. Only one shorter-wavelength super-Gaussian spectral filter is adopted for generation of GLI. (B) Functions of the offset spectral filter.
    Floquet linear stability analysis of simplified structure in the all-normal dispersion regime. (A) Floquet spectrum as a function of the pump. (B) Temporal evolution over 200 round trips at the output of Coupler2. The remaining parameters are Δω=1 nm, EIN=7.0, and δ0=1.3 rad. (C) Evolution of the absolute values of the amplitude of the most unstable modes a(+Ω) and a(−Ω) (blue and red lines, respectively). The losses are introduced at points marked F in time. (D) Dynamics of the complex amplitude a(+Ω) of the most unstable mode calculated by direct integration of the Ikeda map. The adjacent cavity periods are successively represented by different colors. The direction of temporal evolution is indicated by arrows.
    Fig. 10. Floquet linear stability analysis of simplified structure in the all-normal dispersion regime. (A) Floquet spectrum as a function of the pump. (B) Temporal evolution over 200 round trips at the output of Coupler2. The remaining parameters are Δω=1  nm, EIN=7.0, and δ0=1.3  rad. (C) Evolution of the absolute values of the amplitude of the most unstable modes a(+Ω) and a(Ω) (blue and red lines, respectively). The losses are introduced at points marked F in time. (D) Dynamics of the complex amplitude a(+Ω) of the most unstable mode calculated by direct integration of the Ikeda map. The adjacent cavity periods are successively represented by different colors. The direction of temporal evolution is indicated by arrows.
    Floquet linear stability analysis of simplified structure in the all-anomalous dispersion regime. (A) Floquet spectrum as a function of the pump. (B) Temporal evolution over 200 round trips at the output of Coupler2. The remaining parameters are LSMF=20.0 m, T=0.8, σ=4 nm, Δω=2.4 nm, δ0=1.8 rad, EIN=6.6, and total GVD=−0.458 ps2. (C) Evolution of the absolute values of the amplitude of the most unstable modes a(+Ω) and a(−Ω) (blue and red lines, respectively). The losses are introduced at points marked F in time. (D) Dynamics of the complex amplitude a(+Ω) of the most unstable mode calculated by direct integration of the Ikeda map. The adjacent cavity periods are successively represented by different colors. The direction of temporal evolution is indicated by arrows.
    Fig. 11. Floquet linear stability analysis of simplified structure in the all-anomalous dispersion regime. (A) Floquet spectrum as a function of the pump. (B) Temporal evolution over 200 round trips at the output of Coupler2. The remaining parameters are LSMF=20.0  m, T=0.8, σ=4  nm, Δω=2.4  nm, δ0=1.8  rad, EIN=6.6, and total GVD=0.458  ps2. (C) Evolution of the absolute values of the amplitude of the most unstable modes a(+Ω) and a(Ω) (blue and red lines, respectively). The losses are introduced at points marked F in time. (D) Dynamics of the complex amplitude a(+Ω) of the most unstable mode calculated by direct integration of the Ikeda map. The adjacent cavity periods are successively represented by different colors. The direction of temporal evolution is indicated by arrows.
    Floquet linear stability analysis of parametric instability in the all-normal dispersion regime. (A) Floquet spectrum as a function of the pump; (B) Floquet spectrum calculated with parameters of LDCF=7.2 m, T=0.8, δ0=1.3 rad, EIN=6.4, and total GVD=+1.08 ps2; (C) evolution of the absolute values of the amplitude of the most unstable modes a(+Ω) and a(−Ω) (blue and red lines, respectively). (D) Dynamics of the complex amplitude a(+Ω) of the most unstable mode calculated by direct integration of the Ikeda map. The adjacent cavity periods are successively represented by different colors. The direction of temporal evolution is indicated by arrows.
    Fig. 12. Floquet linear stability analysis of parametric instability in the all-normal dispersion regime. (A) Floquet spectrum as a function of the pump; (B) Floquet spectrum calculated with parameters of LDCF=7.2  m, T=0.8, δ0=1.3  rad, EIN=6.4, and total GVD=+1.08  ps2; (C) evolution of the absolute values of the amplitude of the most unstable modes a(+Ω) and a(Ω) (blue and red lines, respectively). (D) Dynamics of the complex amplitude a(+Ω) of the most unstable mode calculated by direct integration of the Ikeda map. The adjacent cavity periods are successively represented by different colors. The direction of temporal evolution is indicated by arrows.
    Floquet linear stability analysis of parametric instability in the strong dispersion-managed regime. (A) Floquet spectrum as a function of the pump; (B) Floquet spectrum calculated with parameters of LDCF=1.0 m, LSMF=6.0 m, T=0.8, δ0=1.3 rad, EIN=8.4, and total GVD=+0.0130 ps2; (C) evolution of the absolute values of the amplitude of the most unstable modes a(+Ω) and a(−Ω) (blue and red lines, respectively). (D) Dynamics of the complex amplitude a(+Ω) of the most unstable mode calculated by direct integration of the Ikeda map. The adjacent cavity periods are successively represented by different colors. The direction of temporal evolution is indicated by arrows.
    Fig. 13. Floquet linear stability analysis of parametric instability in the strong dispersion-managed regime. (A) Floquet spectrum as a function of the pump; (B) Floquet spectrum calculated with parameters of LDCF=1.0  m, LSMF=6.0  m, T=0.8, δ0=1.3  rad, EIN=8.4, and total GVD=+0.0130  ps2; (C) evolution of the absolute values of the amplitude of the most unstable modes a(+Ω) and a(Ω) (blue and red lines, respectively). (D) Dynamics of the complex amplitude a(+Ω) of the most unstable mode calculated by direct integration of the Ikeda map. The adjacent cavity periods are successively represented by different colors. The direction of temporal evolution is indicated by arrows.
    Pan Wang, Jiangyong He, Xiaosheng Xiao, Zhi Wang, Yange Liu. Sub-terahertz-repetition-rate frequency comb generated by filter-induced instabilities in passive driven fiber resonators[J]. Photonics Research, 2022, 10(2): 465
    Download Citation