
Pan Wang, Jiangyong He, Xiaosheng Xiao, Zhi Wang, Yange Liu, "Sub-terahertz-repetition-rate frequency comb generated by filter-induced instabilities in passive driven fiber resonators," Photonics Res. 10, 465 (2022)
- Photonics Research
- Vol. 10, Issue 2, 465 (2022)
Abstract
1. INTRODUCTION
Optical frequency combs (OFCs) consist of uniformly spaced discrete spectral lines. Frequency combs have seen a substantial development in the past decade, due to important applications in fundamental and applied physics, such as gas sensing [1], metrology [2], and attosecond physics [3]. Various schemes have been implemented for OFC generation, including Ti:sapphire mode-locked lasers [4], rare-earth-doped fiber lasers [5], quantum cascade lasers [6], electro-optic modulation comb generators [7], and externally driven passive resonators [8,9]. Among them, high resonance quality factor microresonators stand out, providing access to ultrahigh repetition rates in the gigahertz to terahertz range attributed to chip-scale integration. This approach, operating at the previously unattainable repetition rate, exhibits great potential in applications where access to individual comb lines is desirable, such as optical waveform synthesis [10], direct comb spectroscopy [11], high capacity telecommunications [12], and astrophysical spectrometer calibration [13,14]. Note that, however, there are still some technical challenges with the sophisticated control protocols to stabilize the comb repetition rate and carrier envelope phase. In addition, the repetition rate is difficult to tune with the fixed resonator optic-geometrical parameters. Such drawbacks limit the applications in ultrahigh-repetition-rate comb generation of the microresonator-based devices. Exploration of alternative concepts and methods of ultrahigh-repetition-rate comb production remains a fascinating topic in the field of ultrafast physics.
Interestingly, a novel class of alternative concepts has been proposed recently for ultrahigh-repetition-rate frequency comb generation in the sub-terahertz (THz) scale, i.e., the dissipative Faraday instability (DFI) in lasers [15–18], the self-induced Faraday instability in lasers [19], and gain-through-loss instability (GLI) in nonlinear systems such as parametric amplification and fiber resonators [20–22]. This provides supplements to the general family of modulation instabilities (MIs). MI is a ubiquitous mechanism in various nonlinear physical systems, where the symmetry breakup of homogeneous spatiotemporal background states leads to the formation of coherent patterns. There are several well-known classes of MI, including the Benjamin–Feir instability (BFI) in the framework of the nonlinear Schrödinger equation (NLSE) with anomalous group velocity dispersion (GVD) [23,24], the Faraday instability (FI) resulting from the periodic modulation of dispersive parameters of nonlinear systems [25–28], and other parametric instability in fiber amplified links and passive fiber loops related to periodic gain [29–32]. Note that the dissipative effects in resonators modify the features of parametric instabilities, which can also occur in conservative settings, leading to conservative parametric MI (non-BFI) in the normal dispersion regime [33].
In the mechanism of the DFI process, the periodic antiphase (zigzag) modulation of spectrally dependent losses leads to unequal instantaneous strength for the signal and idler waves, being symmetrically located with respect to the pump frequency [15]. This can result in counterintuitive energy transfer from the pump field to the symmetric signal and idler waves, where the phase-matching condition could be further modified via the filter phase associated to Kramers–Kronig relations [22]. Floquet stability analysis is usually utilized to reveal the MI spectrum evolution based on the well-known Ikeda map [22,25]. The concept of DFI has shown great potential in applications of various nonlinear optical systems [20], such as signal amplification processes, optical parametric oscillators, Mamyshev oscillators, and passive driven resonators. However, note that the research on the DFI mechanism is still insufficient, with only a few pioneering reports on theoretical or experimental investigations in recent years [15–22].
Sign up for Photonics Research TOC. Get the latest issue of Photonics Research delivered right to you!Sign up now
Very recently, the concept of GLI has been preliminarily realized in passive driven fiber resonators, adopting one intracavity asymmetric spectral filter to trigger the parametric amplification process and exhibiting a promising candidate in sub-THz frequency comb generation [21,22]. In Refs. [21,22], multiple sidebands are generated through the cascaded four-wave mixing process in the all-normal dispersion regime, where the BFI is inhibited. Dispersion management would significantly influence the nonlinear dynamics of resonators. For example, the scheme of the dispersion-management concept of fiber lasers has been currently introduced into passive driven fiber resonators, facilitating novel cavity soliton formation mechanisms, such as stretched-pulse solitons and chirped dissipative solitons [34,35]. However, in passive driven fiber resonators, the role of dispersion management in the GLI mechanism has not been investigated to date.
In the present paper, we investigate the influence of cavity dispersion on filter-induced instability (FII) formation mechanism, including DFI and GLI, in passive driven fiber resonators, with zigzag intracavity spectral filters. Sub-THz-repetition-rate coherent frequency combs are demonstrated by optimizing the cavity dispersion regimes. The Floquet spectra are calculated utilizing the Floquet stability analysis of the homogeneous solution. In the dominant FII mechanism, the maximally growing unstable mode frequency decreases with the field intensity, which contrasts with the typical BFI scaling. The comparison with parametric instability is also conducted in our passive driven resonators, beneficial to the further understanding of this novel modulation instability.
2. SIMULATION SETUP
The scheme diagram of the passive driven resonator is depicted in Fig. 1. In the scheme, the 1550 nm continuous wave (cw) is divided into two parts to drive the passive resonator. As illustrated in Fig. 1, the driven frequency of the cw signal is piezoelectrically controlled by output of a proportional-integral-derivative (PID) control circuit, utilizing one of the cavity output signals as the error signal. In view of the experiment, the resonator is driven by a train of nanosecond square pulses, generated by the intensity modulator (IM), to trigger the parametric processes [34,35]. An erbium-doped fiber amplifier (EDFA) is utilized to amplify the square-pulse pump signal. In the resonator, zigzag intracavity spectral filters are introduced to facilitate the DFI mechanism formation. To investigate the role of dispersion on the DFI mechanism, the unidirectional resonator consists of different fibers for flexible dispersion management, with opposite signs of GVD (single-mode fiber with anomalous GVD and dispersion compensation fiber with normal GVD [36]).
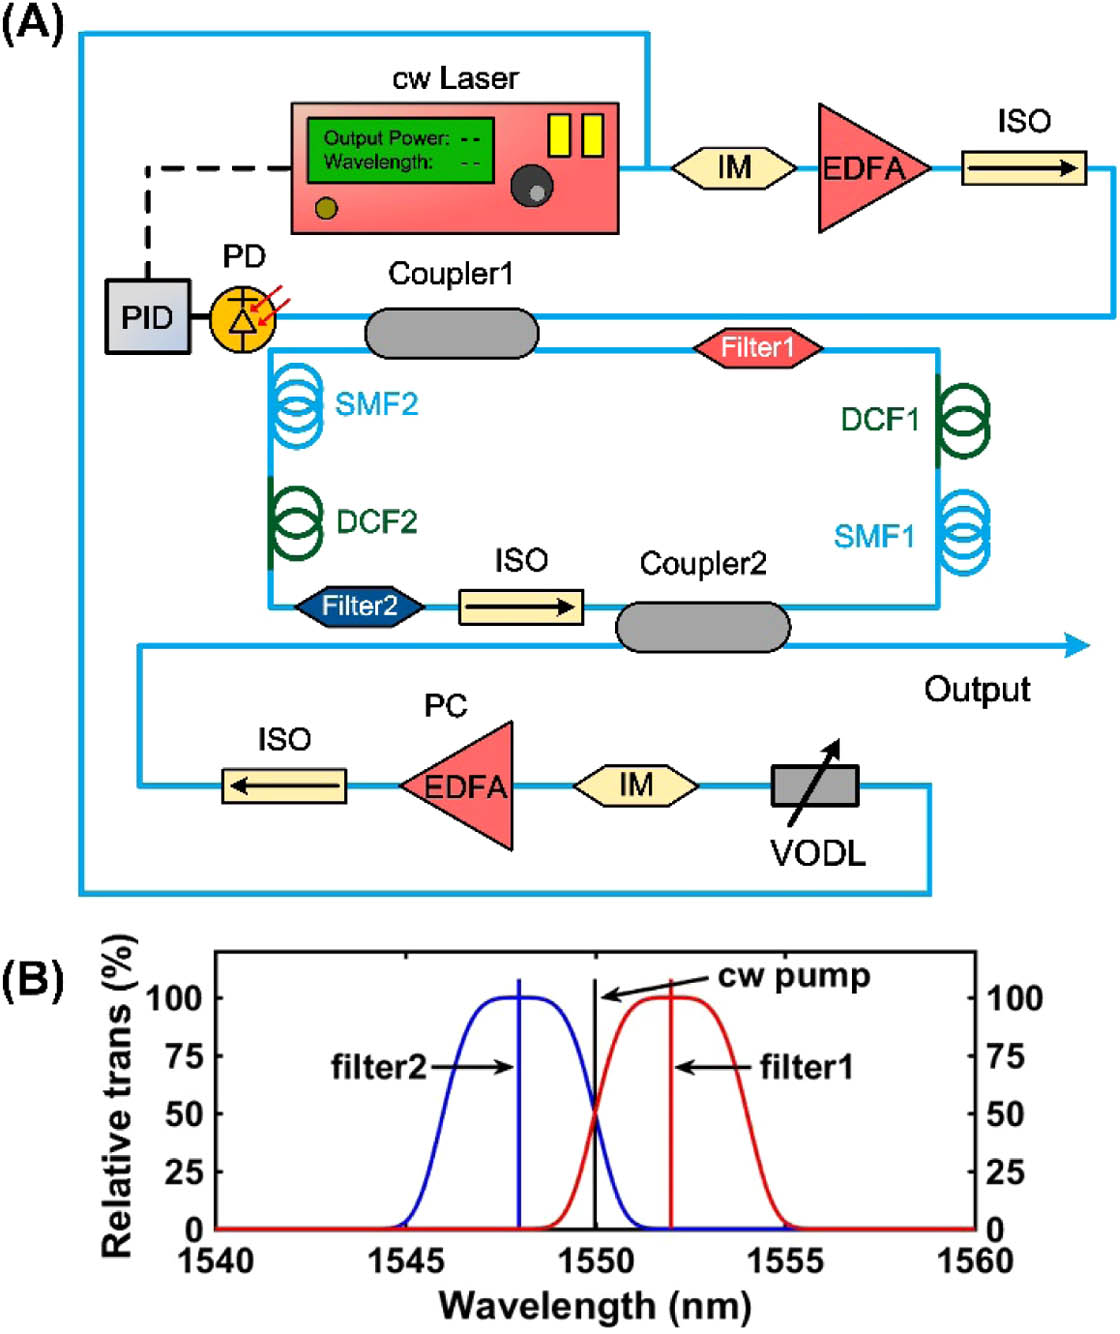
Figure 1.(A) Schematic diagram of the passive driven resonator configuration. IM, intensity modulator; EDFA, erbium-doped fiber amplifier; ISO, isolator; PD, photodiode; PID, proportional-integral-derivative; Filter1, longer-wavelength super-Gaussian spectral filter; Filter2, shorter-wavelength super-Gaussian spectral filter; VODL, variable optical delay line; SMF, single-mode fiber; DCF, dispersion compensation fiber. (B) Functions of the offset spectral filters.
The pulse evolution in the resonators can be modeled by the Ikeda map approach, with the following coupled equations [22,25]:
The offset spectral filters, located before the couplers, without loss of generality, are set to have transmission function of super-Gaussian profiles. The central frequencies of the offset filters are
A. All-Normal Dispersion Regime
First, we study the DFI formation in the all-normal dispersion regime in the passive driven fiber resonator. We use the following parameters for numerical simulations:
The numerical analyses are performed by introducing two independent sufficiently small complex perturbation modes of
The Floquet spectra are plotted in Fig. 2. Note that only the positive part of the spectrum is shown in our calculation results, considering the frequency symmetry of the instability spectrum. In Figs. 2(A), 2(B), and 2(D), the logarithm function of the largest eigenvalue,
![]()
Figure 2.Floquet linear stability analysis in the all-normal dispersion regime. (A) Floquet spectrum as a function of the pump; (B) Floquet spectrum as a function of frequency detuning of filters; (C) Floquet spectrum calculated with parameters of
The Floquet spectrum with
As shown in Fig. 2(D), we also find that the Floquet spectrum could be tailored to modify the number of extreme values by changing the dissipative function of modulation period
Subsequently, the evolution dynamics of complex amplitude
To better understand the DFI mechanism, the spatiotemporal pattern formation is further investigated by solving the coupled Eqs. (1)–(3) of pulse evolution in the resonator. The results are illustrated in Figs. 3 and 4.
![]()
Figure 3.Spatiotemporal dynamics of pattern formation in the all-normal dispersion regime: (A) temporal and (C) spectral evolution over 200 round trips at the output of Coupler2; (B) temporal and (D) spectral evolution during per cavity round trip. A, B, C, and D represent the DCF1, filter1 + Coupler1, DCF2, filter2 + Coupler2. The remaining parameters are
![]()
Figure 4.Spatiotemporal profiles of pattern formation in the all-normal dispersion regime: (A) before and (B) after the interaction with the shorter-wavelength filter; (C) pulse train temporal and phase profiles after the shorter-wavelength filter; (D) spectral profile after the shorter-wavelength filter.
The spatiotemporal dynamics of pattern formation is depicted in Fig. 3. As shown in Figs. 3(A) and 3(C), ultrahigh harmonic mode locking is achieved, with temporal period of pulse train measured to be 9.12 ps. The pulse repetition rate is calculated to be 110 GHz, which matches well with the Floquet spectrum calculated with the same cavity parameters. The temporal and spectral evolutions during per cavity round trip are also displayed in Figs. 3(B) and 3(D). The envelope of the spectrum is observed to broaden during the pulse propagation in the normal dispersion fibers, which is attributed to the nonlinear self-phase modulation effect of each individual pulse in the fibers. The corresponding number of spectral comb lines increases during the evolution, revealing energy transfer to the spectral wings relating this DFI mechanism. Note that the temporal separations between adjacent pulses remain constant, indicating ultrahigh harmonic stability during the propagation. Figures 4(A) and 4(B) are individual pulse profiles before and after the spectral filter. The frequency chirping is typical of pulses after propagation in large positive GVD value fibers. The phase relationship of the pulse train is further tested, exhibiting an in-phase condition between the adjacent pulses, demonstrating the high coherence of the harmonic mode locking. The resonator will turn to chaos and collision operation if the wavelength distance between the two spectral filters is decreased under a certain degree, similar to Ref. [17].
B. Dispersion-Managed Regime
Note that the role of dispersion management in DFI formation in passive driven fiber resonators has not been investigated to date. In this section, the Floquet linear stability analysis in the dispersion-managed regime is further conducted. To give systematic investigations of the DFI mechanism in different cavity dispersion regimes, i.e., weak and strong dispersion-managed and all-anomalous regimes, several results, under different sets of cavity parameters, are shown in Figs. 5–8. The adopted parameters for SMF are
![]()
Figure 5.Floquet linear stability analysis in dispersion-managed regimes: (A) Floquet spectrum and (B) temporal evolution over 200 round trips after Coupler2, calculated with parameters of
![]()
Figure 6.Dynamics of complex amplitude of the most unstable mode and Floquet spectrum in dispersion-managed regimes: (A) perturbation evolution calculated with parameters as in Fig.
![]()
Figure 7.Floquet linear stability analysis in the all-anomalous dispersion regime. (A) Floquet spectrum as a function of the pump; (B) Floquet spectrum as a function of frequency detuning of filters; (C) Floquet spectrum calculated with parameters of
![]()
Figure 8.Spatiotemporal dynamics of pattern formation in the all-anomalous dispersion regime. (A) temporal and (C) spectral evolution over 200 round trips at the output of Coupler2. (B) Temporal and (D) spectral evolution during per cavity round trip. A, B, C, and D represent the DCF1, filter1 + Coupler1, DCF2, and filter2 + Coupler2. The remaining parameters are
As in Fig. 5(A), the frequency of the maximally growing unstable mode is calculated to be 97.5 GHz, consistent with the 10.3 ps temporal period of the pulse train in Fig. 5(B). Results with near-zero GVD regimes are further calculated with the corresponding total GVD of
To give more insight into this filter-induced instability, the dynamics of the complex amplitude of the most unstable mode must be revealed. Figure 6 provides an intuitive understanding of this nonlinear evolution dynamics. It is worth noting that, in the case of Fig. 6(A) with large net positive cavity GVD in the weak dispersion managed regime, the complex amplitude evolution of the perturbation remains similar profile to the all-normal dispersion regime, circulating anticlockwise in the phase space. The frequency scaling [see Fig. 6(B)] of the most unstable mode exhibits an inverse relationship with the pump field.
Note that there are some distinctive characteristics related to the near-zero GVD regimes. Figures 6(C) and 6(E) illustrate the corresponding evolution of the perturbation’s complex amplitude. The adjacent half-cavity periods, after the longer- or shorter-wavelength spectral filters, are represented by different colors of blue and red, respectively. The trajectories are rotating anticlockwise, except that the circulating centers are shifting along the horizontal coordinate of the phase space. After every cavity period, the trajectory returns to the origin of coordinates following interaction with the shorter-wavelength spectral filter. The Floquet spectra as a function of the pump are shown in Figs. 6(D) and 6(F). Similar to Ref. [27], the bending of the MI bands with power toward low frequency or high frequency depends on the sign of net dispersion. The relationship between the most unstable frequency and the pump deviates from Fig. 6(A), and the frequency barely changes over a wide intensity range. This could be explained by the combined influence with the BFI, a common phenomenon in the framework of NLSE with anomalous GVD [23,24]. In the strong dispersion managed regimes with near-zero GVD, the combination of the DFI and BFI leads to balanced solutions, in contrast with the case of the all-normal dispersion regime.
C. All-Anomalous Dispersion Regime
Moreover, the DFI formation is further investigated, extending to the limiting condition of the all-anomalous dispersion regime to give more insight into the role of dispersion. The results are illustrated in Fig. 7. Figure 7(A) shows the Floquet spectrum as a function of the pump. Note that the frequency of the most unstable mode gradually blueshifts with the increase of the pump, revealing influence of the BFI. The Floquet spectra as functions of the filter frequency detuning as well as the parametric modulation period are also depicted in Figs. 7(B) and 7(D), respectively, revealing slight variations. In the Floquet spectrum in Fig. 7(C) with the
In the case of traditional BFI illustrated in Ref. [15], the growth of absolute amplitudes is continuous during the whole evolution process due to the absence of periodic external forcing. However, note that in contrast with the characteristics of BFI, in our simulations, oscillations of the absolute amplitude are still obtained, synchronized with the zigzag spectral filtering periods. Meanwhile, compared with the all-normal dispersion regime, after interaction with the spectral filters, the most unstable modes experience much higher attenuation of the absolute amplitude. Finally, the evolution of complex amplitude
The spatiotemporal pattern formation is also investigated as shown in Fig. 8. Figures 8(A) and 8(C) illustrate the temporal and spectral evolution of the ultrahigh harmonic mode locking operation, respectively. The pulse repetition rate coincides with the frequency value of the most unstable mode calculated in Fig. 7(C). The spectrum exhibits high-contrast modulation with period of 385 GHz between the adjacent spectral comb lines. Nonlinear self-phase modulation leads to the spectral broadening along propagation, with the pulse train energy transferred into frequency comb lines in the spectral wings. We also test the phase condition of the harmonic mode-locking pulse train, revealing a fixed phase relationship between the adjacent pulses, demonstrating high mode-locking coherence. Note that Kelly sidebands can be generated in a fiber laser operated in the anomalous dispersion regime [37], which is not our case where the dispersive wave components are restrained due to the action of detuned spectral filters in the resonator.
In our simulations, filters with different kinds of profiles are also tried, and we find that the filter profile does not qualitatively affect the results.
D. One-Offset Filter Scheme
In addition, further simplification of the passive driven resonator structure has also been explored. As illustrated in Fig. 9, modeling without loss of generality, only one offset shorter-wavelength super-Gaussian spectral filter is adopted in the system for the excitation of the FII, also named GLI. In this modified structure, the frequency detuning, between the shorter-wavelength spectral filter and the cw pump, is represented by
![]()
Figure 9.(A) Schematic diagram of the simplified passive driven resonator configuration. Only one shorter-wavelength super-Gaussian spectral filter is adopted for generation of GLI. (B) Functions of the offset spectral filter.
The all-normal dispersion regime is first investigated. The system parameters are chosen as follows:
![]()
Figure 10.Floquet linear stability analysis of simplified structure in the all-normal dispersion regime. (A) Floquet spectrum as a function of the pump. (B) Temporal evolution over 200 round trips at the output of Coupler2. The remaining parameters are
The remaining parameters for Figs. 10(B), 10(C), and 10(D) are
These results confirm the feasibility of system simplification with one offset spectral filter for GLI formation. However, it is worth noting that, as shown in Fig. 10(A), the MI gain spectrum exhibits much broader bandwidth than the dual-offset-filter system. Further optimization of the spectral filter profile might benefit to sharpen the MI gain spectrum as well as to increase the growth speed of the most unstable modes.
In the one-offset spectral filter structure, the GLI formation in dispersion-managed regime is also investigated, exhibiting similar characteristics to the dual-offset-filter system. In case of the small perturbation evolution dynamics, anticlockwise rotating trajectory of
To further elucidate the GLI mechanism in the one-offset filter fiber resonator structure, we conduct numerical analysis in the all-anomalous dispersion regime. The results are illustrated in Fig. 11.
![]()
Figure 11.Floquet linear stability analysis of simplified structure in the all-anomalous dispersion regime. (A) Floquet spectrum as a function of the pump. (B) Temporal evolution over 200 round trips at the output of Coupler2. The remaining parameters are
The Floquet spectrum as a function of pump field is shown in Fig. 11(A), where the white dashed line, describing the maximum
E. Comparision with Parametric Instability
Furthermore, the parametric instability is investigated for comparison within the same cavity structure as in Fig. 10, except the absence of the offset spectral filter. Attributed to the all-normal cavity dispersion, the BFI is here completely inhibited [23,24]. Thus, the resonator operates at the BFI stable regime, and we obtain parametric instability. The Floquet stability analysis results are illustrated in Fig. 12.
![]()
Figure 12.Floquet linear stability analysis of parametric instability in the all-normal dispersion regime. (A) Floquet spectrum as a function of the pump; (B) Floquet spectrum calculated with parameters of
Figure 12(A) shows the Floquet spectrum as a function of the pump. Multiple extreme values are noticeably observed in the spectrum. The extreme values evolve toward lower frequency with the increase of pump field, which contrasts with the characteristics of the BFI scaling. The Floquet spectrum with
Moreover, the Floquet stability analysis is also conducted in the strong dispersion-managed regime with absence of filters. The results are shown in Fig. 13. As shown in Fig. 13(B), under the cavity pump level of
![]()
Figure 13.Floquet linear stability analysis of parametric instability in the strong dispersion-managed regime. (A) Floquet spectrum as a function of the pump; (B) Floquet spectrum calculated with parameters of
This comparison facilitates understanding of the general family of modulation instabilities.
4. CONCLUSION
In conclusion, we demonstrate the sub-THz-repetition-rate frequency comb generation induced by FII in passive fiber resonators at different cavity dispersion regimes. Zigzag spectral filters are introduced in the resonators to trigger the DFI formation. Coherent temporal and spectral patterns are obtained, where the repetition rate is consistent with the most unstable mode frequency, solved by the Floquet stability analysis method.
For the all-normal dispersion resonator with dual offset spectral filters, dominant DFI formation is obtained, demonstrated by the typical DFI scaling, where the most unstable mode frequency decreases with pump field intensity. The maximally growing modes correspond to the maximum peaks in the Floquet spectrum, and the absolute amplitude of these modes increases exponentially along propagation in the unit of modulation period
Acknowledgment
Acknowledgment. P. Wang acknowledges the inspiration in the Philip. St. J. Russell Division, Max Planck Institute for the Science of Light, Erlangen, Germany.
References
[1] M. J. Thorpe, K. D. Moll, R. J. Jones, B. Safdi, J. Ye. Broadband cavity ringdown spectroscopy for sensitive and rapid molecular detection. Science, 311, 1595-1599(2006).
[2] T. Udem, R. Holzwarth, T. W. Hänsch. Optical frequency metrology. Nature, 416, 233-237(2002).
[3] E. Goulielmakis, V. S. Yakovlev, A. L. Cavalieri, M. Uiberacker, V. Pervak, A. Apolonski, R. Kienberger, U. Kleineberg, F. Krausz. Attosecond control and measurement: lightwave electronics. Science, 317, 769-775(2007).
[4] B. Lomsadze, S. T. Cundiff. Frequency combs enable rapid and high-resolution multidimensional coherent spectroscopy. Science, 357, 1389-1391(2017).
[5] N. Coluccelli, M. Cassinerio, B. Redding, H. Cao, P. Laporta, G. Galzerano. The optical frequency comb fibre spectrometer. Nat. Commun., 7, 12995(2016).
[6] A. Hugi, G. Villares, S. Blaser, H. C. Liu, J. Faist. Mid-infrared frequency comb based on a quantum cascade laser. Nature, 492, 229-233(2012).
[7] K. Beha, D. C. Cole, P. Del’Haye, A. Coillet, S. A. Diddams, S. B. Papp. Electronic synthesis of light. Optica, 4, 406-411(2017).
[8] T. J. Kippenberg, R. Holzwarth, S. A. Diddams. Microresonator-based optical frequency combs. Science, 332, 555-559(2011).
[9] F. Leo, S. Coen, P. Kockaert, S. Gorza, P. Emplit, M. Haelterman. Temporal cavity solitons in one-dimensional Kerr media as bits in an all-optical buffer. Nat. Photonics, 4, 471-476(2010).
[10] Z. Jiang, C. Huang, D. E. Leaird, A. M. Weiner. Optical arbitrary waveform processing of more than 100 spectral comb lines. Nat. Photonics, 1, 463-467(2007).
[11] S. A. Diddams, L. Hollberg, V. Mbele. Molecular fingerprinting with the resolved modes of a femtosecond laser frequency comb. Nature, 445, 627-630(2007).
[12] P. Marin-Palomo, J. N. Kemal, M. Karpov, A. Kordts, J. Pfeifle, M. H. P. Pfeiffer, P. Trocha, S. Wolf, V. Brasch, M. H. Anderson, R. Rosenberger, K. Vijayan, W. Freude, T. J. Kippenberg, C. Koos. Microresonator-based solitons for massively parallel coherent optical communications. Nature, 546, 274-279(2017).
[13] T. Steinmetz, T. Wilken, C. Araujo-Hauck, R. Holzwarth, T. W. Hänsch, L. Pasquini, A. Manescau, S. D’Odorico, M. T. Murphy, T. Kentischer, W. Schmidt, T. Udem. Laser frequency combs for astronomical observations. Science, 321, 1335-1337(2008).
[14] C. Li, A. J. Benedick, P. Fendel, A. G. Glenday, F. X. Kärtner, D. F. Phillips, D. Sasselov, A. Szentgyorgyi, R. L. Walsworth. A laser frequency comb that enables radial velocity measurements with a precision of 1 cm s-1. Nature, 452, 610-612(2008).
[15] A. M. Perego, N. Tarasov, D. V. Churkin, S. K. Turitsyn, K. Staliunas. Pattern generation by dissipative parametric instability. Phys. Rev. Lett., 116, 028701(2016).
[16] N. Tarasov, A. M. Perego, D. V. Churkin, K. Staliunas, S. K. Turitsyn. Mode-locking via dissipative Faraday instability. Nat. Commun., 7, 12441(2016).
[17] A. M. Perego. High-repetition-rate, multi-pulse all normal-dispersion fiber laser. Opt. Lett., 42, 3574-3577(2017).
[18] P. Wang, S. Yao, P. Grelu, X. Xiao, C. Yang. Pattern formation in 2-μm Tm Mamyshev oscillators associated with the dissipative Faraday instability. Photon. Res., 7, 1287-1295(2019).
[19] A. M. Perego, S. V. Smirnov, K. Staliunas, D. V. Churkin, S. Wabnitz. Self-induced Faraday instability laser. Phys. Rev. Lett., 120, 213902(2018).
[20] A. M. Perego, S. K. Turitsyn, K. Staliunas. Gain through losses in nonlinear optics. Light Sci. Appl., 7, 43(2018).
[21] F. Bessin, A. M. Perego, K. Staliunas, S. K. Turitsyn, A. Kudlinski, M. Conforti, A. Mussot. Gain-through-filtering enables tuneable frequency comb generation in passive optical resonators. Nat. Commun., 10, 4489(2019).
[22] A. M. Perego, A. Mussot, M. Conforti. Theory of filter-induced modulation instability in driven passive optical resonators. Phys. Rev. A, 103, 013522(2021).
[23] K. Tai, A. Hasegawa, A. Tomita. Observation of modulational instability in optical fibers. Phys. Rev. Lett., 56, 135-138(1986).
[24] L. A. Lugiato, R. Lefever. Spatial dissipative structures in passive optical systems. Phys. Rev. Lett., 58, 2209-2211(1987).
[25] K. Staliunas, C. Hang, V. V. Konotop. Parametric patterns in optical fiber ring nonlinear resonators. Phys. Rev. A, 88, 023846(2013).
[26] F. Copie, M. Conforti, A. Kudlinski, A. Mussot, S. Trillo. Competing Turing and Faraday instabilities in longitudinally modulated passive resonators. Phys. Rev. Lett., 116, 143901(2016).
[27] M. Conforti, A. Mussot, A. Kudlinski, S. Trillo. Modulational instability in dispersion oscillating fiber ring cavities. Opt. Lett., 39, 4200-4203(2014).
[28] M. Conforti, F. Copie, A. Mussot, A. Kudlinski, S. Trillo. Parametric instabilities in modulated fiber ring cavities. Opt. Lett., 41, 5027-5030(2016).
[29] M. Haelterman, S. Trillo, S. Wabnitz. Additive-modulation-instability ring laser in the normal dispersion regime of a fiber. Opt. Lett., 17, 745-747(1992).
[30] M. Haelterman, S. Trillo, S. Wabnitz. Dissipative modulation instability in a nonlinear dispersive ring cavity. Opt. Commun., 91, 401-407(1992).
[31] F. Matera, A. Mecozzi, M. Romagnoli, M. Settembre. Sideband instability induced by periodic power variation in long-distance fiber links. Opt. Lett., 18, 1499-1501(1993).
[32] S. Coen, M. Haelterman. Modulational instability induced by cavity boundary conditions in a normally dispersive optical fiber. Phys. Rev. Lett., 79, 4139-4142(1997).
[33] A. Mussot, M. Conforti, S. Trillo, F. Copie, A. Kudlinski. Modulation instability in dispersion oscillating fibers. Adv. Opt. Photon., 10, 1-42(2018).
[34] X. Dong, Q. Yang, C. Spiess, V. G. Bucklew, W. H. Renninger. Stretched-pulse soliton Kerr resonators. Phys. Rev. Lett., 125, 033902(2020).
[35] C. Spiess, Q. Yang, X. Dong, V. G. Bucklew, W. H. Renninger. Chirped dissipative solitons in driven optical resonators. Optica, 8, 861-869(2021).
[36] C. Bao, C. Yang. Stretched cavity soliton in dispersion-managed Kerr resonators. Phys. Rev. A, 92, 023802(2015).
[37] Y. Wang, S. Fu, C. Zhang, X. Tang, J. Kong, J. Lee, L. Zhao. Soliton distillation of pulses from a fiber laser. J. Lightwave Technol., 39, 2542-2546(2021).


Set citation alerts for the article
Please enter your email address

© Copyright 2018-2021 | Chinese Laser Press. All Rights Reserved 沪ICP备15018463号-20