• Chinese Optics Letters
  • Vol. 20, Issue 11, 111401 (2022)
Yuzhuo Wang1、*, Yizun He1, Lingjing Ji1, Jiangyong Hu1, Xing Huang1, Yudi Ma1, Liyang Qiu1, Kaifeng Zhao2、3, and Saijun Wu1、**
Author Affiliations
  • 1Department of Physics, State Key Laboratory of Surface Physics and Key Laboratory of Micro and Nano Photonic Structures (Ministry of Education), Fudan University, Shanghai 200433, China
  • 2Key Laboratory of Nuclear Physics and Ion-Beam Application (Ministry of Education), Fudan University, Shanghai 200433, China
  • 3Institute of Modern Physics, Department of Nuclear Science and Technology, Fudan University, Shanghai 200433, China
  • show less
    DOI: 10.3788/COL202220.111401 Cite this Article Set citation alerts
    Yuzhuo Wang, Yizun He, Lingjing Ji, Jiangyong Hu, Xing Huang, Yudi Ma, Liyang Qiu, Kaifeng Zhao, Saijun Wu. Intense, wideband optical waveform generation by self-balanced amplification of fiber electro-optical sideband modulation[J]. Chinese Optics Letters, 2022, 20(11): 111401 Copy Citation Text show less
    Schematic setup of the waveform generation system. The spectrum of the optical waveform is illustrated at each stage of the amplified modulation. (a) Schematic diagram of fEOM modulation and first optical filtering. CW laser from ECDL is modulated by fEOM with a programmable microwave signal. The fEOM output is collimated into a suitable size and filtered by grating diffraction before being coupled into a single-mode fiber. (b) High-gain optical amplification. TSA1 is seeded from the side port of an optical isolator for double-pass amplification. Optional Filter2 serves to remove the optical carrier from the final output. ECDL, external cavity diode laser; OI, optical isolator; PBS, polarization beamsplitter; BS, beamsplitter.
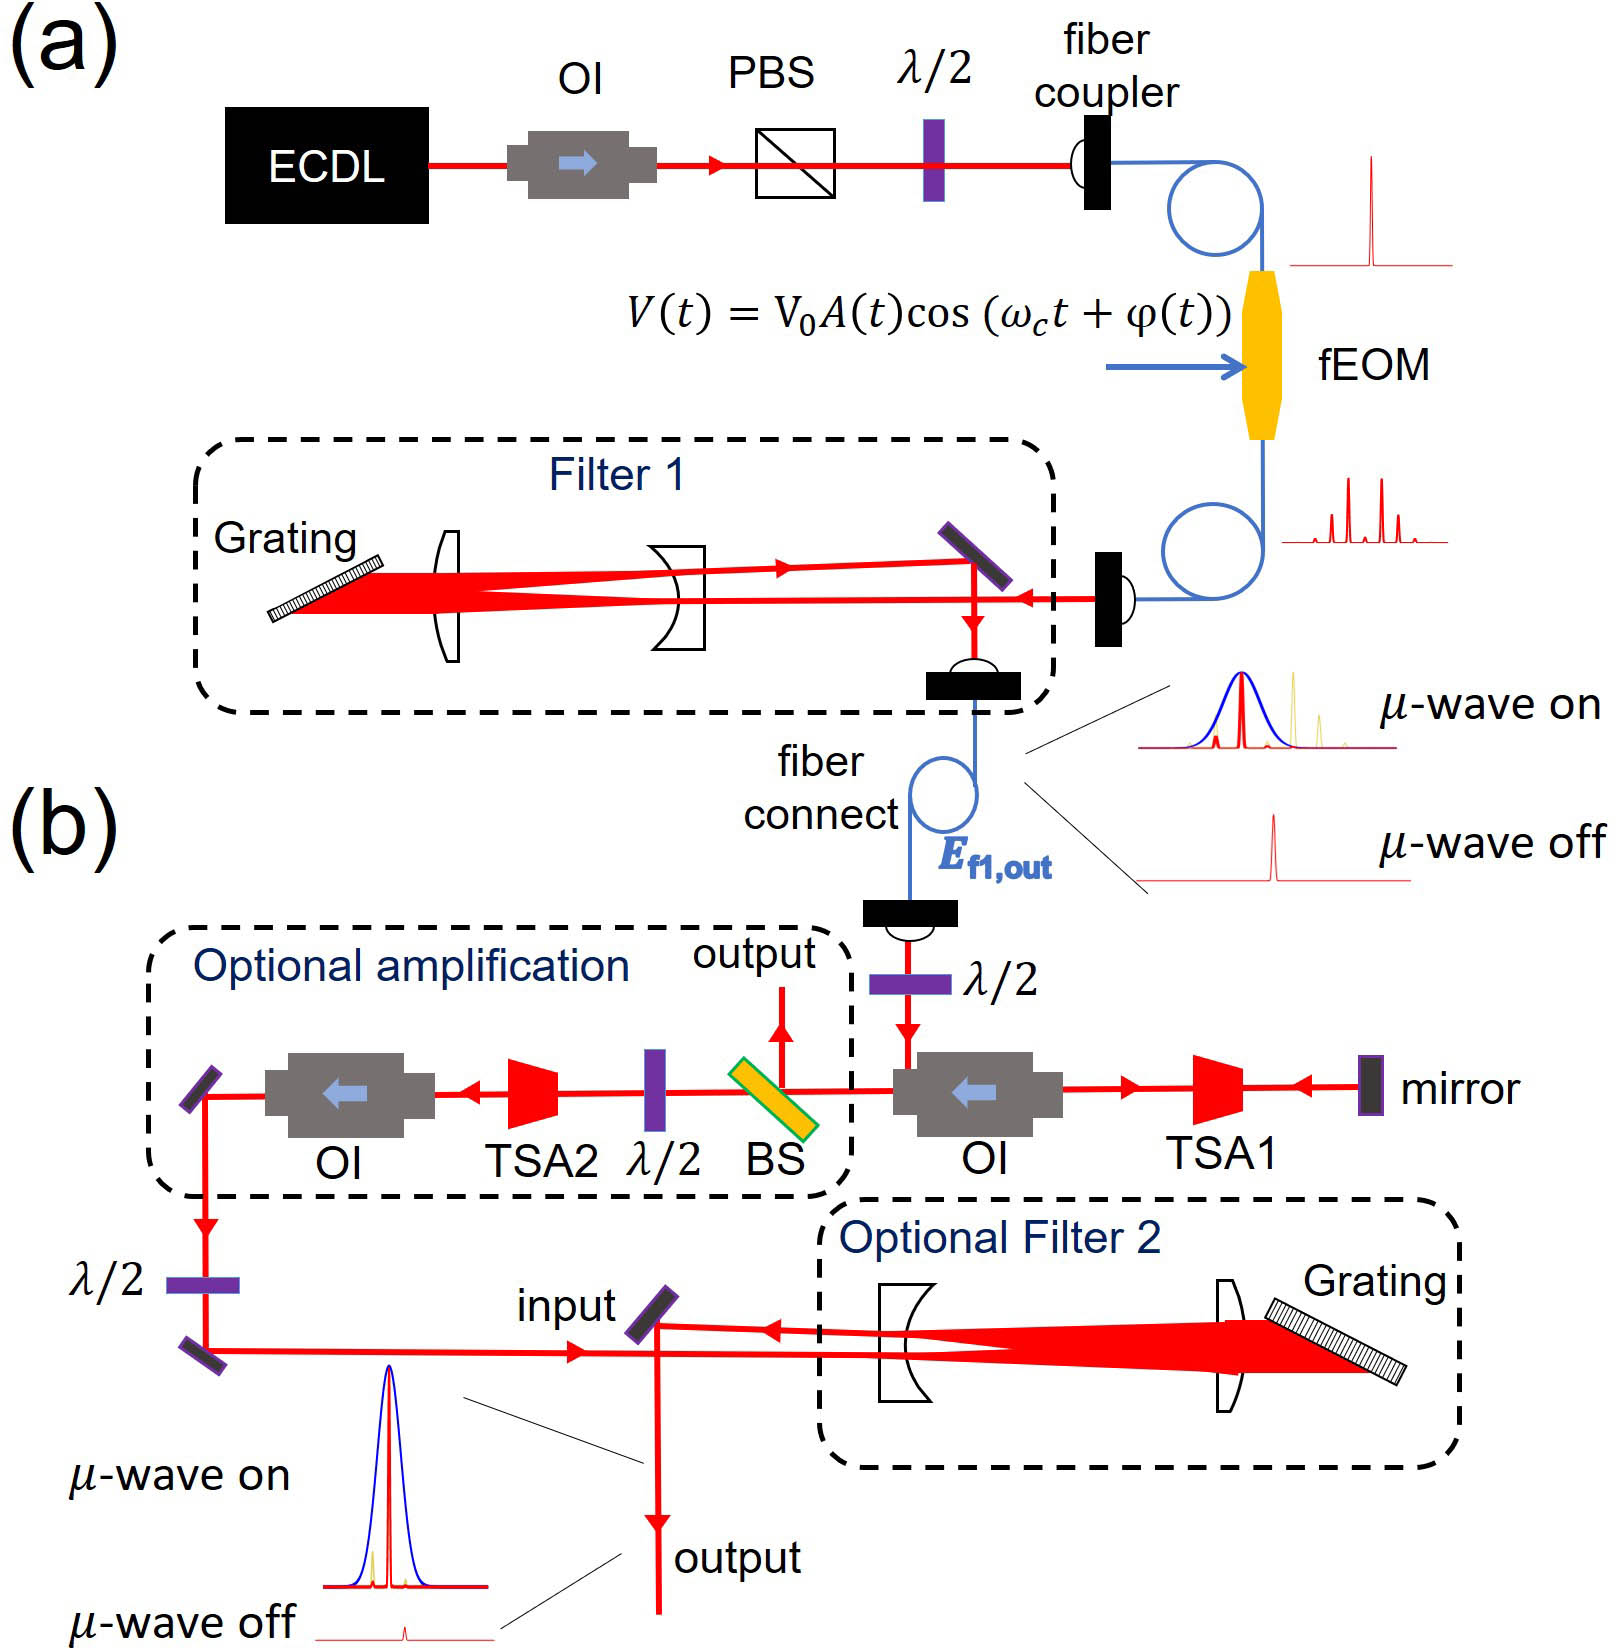
    Fig. 1. Schematic setup of the waveform generation system. The spectrum of the optical waveform is illustrated at each stage of the amplified modulation. (a) Schematic diagram of fEOM modulation and first optical filtering. CW laser from ECDL is modulated by fEOM with a programmable microwave signal. The fEOM output is collimated into a suitable size and filtered by grating diffraction before being coupled into a single-mode fiber. (b) High-gain optical amplification. TSA1 is seeded from the side port of an optical isolator for double-pass amplification. Optional Filter2 serves to remove the optical carrier from the final output. ECDL, external cavity diode laser; OI, optical isolator; PBS, polarization beamsplitter; BS, beamsplitter.
    Characterization of chirped pulses from TSA2 output without Filter2. The frequency sweep range Δf is 1 GHz and 4 GHz for data in (a) and (b), respectively. The heterodyning beat notes are given in (i), from which we derive the (ii) spectrogram and (iv) in-phase quadrature Re(E−1). As in (iii), due to the self-balanced amplification, the total output power stays approximately unchanged, with a fractional deviation <15% during the full-pulse modulation.
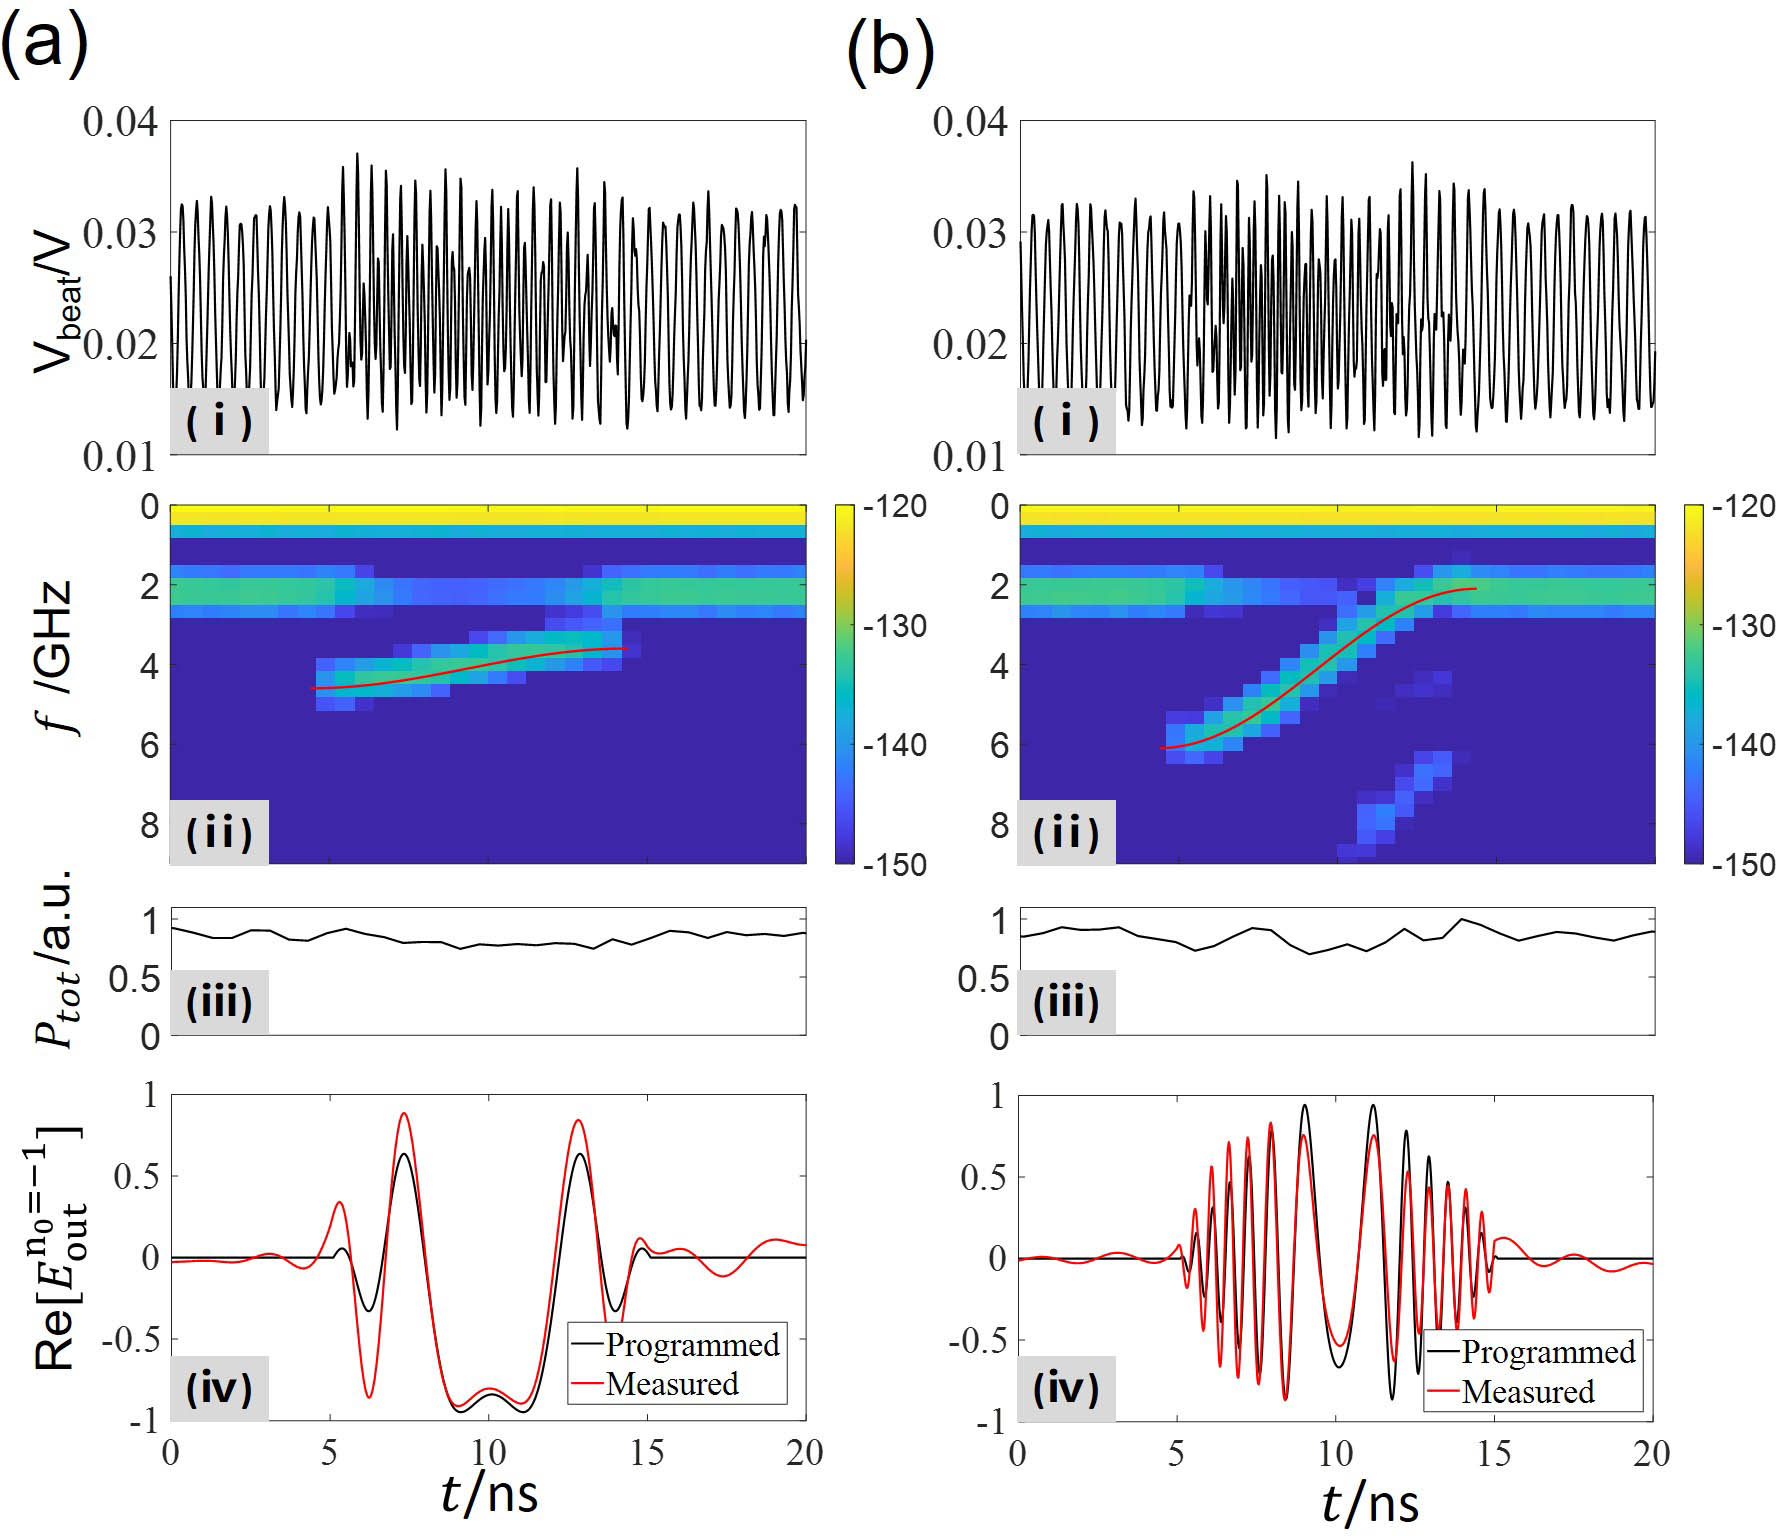
    Fig. 2. Characterization of chirped pulses from TSA2 output without Filter2. The frequency sweep range Δf is 1 GHz and 4 GHz for data in (a) and (b), respectively. The heterodyning beat notes are given in (i), from which we derive the (ii) spectrogram and (iv) in-phase quadrature Re(E−1). As in (iii), due to the self-balanced amplification, the total output power stays approximately unchanged, with a fractional deviation <15% during the full-pulse modulation.
    Accurate phase modulation of TSA2 output. The heterodyning beat notes in (a) are digitally demodulated as described in the text to obtain the time-dependent phase ϕ(t) in (b). The complex data is presented in (c) the phasor diagram.
    Fig. 3. Accurate phase modulation of TSA2 output. The heterodyning beat notes in (a) are digitally demodulated as described in the text to obtain the time-dependent phase ϕ(t) in (b). The complex data is presented in (c) the phasor diagram.
    (a) Level diagram and cooling related transitions on the 87Rb (left) and 85Rb (right) D2 line. (b) Spectragraphs derived from heterodyning beat notes of interleaved nanosecond pulses with τ = 5 ns (left) and τ = 50 ns (right) on log-scale. Fluorescence counts versus τ for 85Rb and 87Rb are shown in (c) and (d), respectively. Red arrows mark the expected location of τ, where multiple square pulses with Trep = 2τ period and coherent phases resonantly drive hyperfine depumping transitions to degrade the MOT performance.
    Fig. 4. (a) Level diagram and cooling related transitions on the 87Rb (left) and 85Rb (right) D2 line. (b) Spectragraphs derived from heterodyning beat notes of interleaved nanosecond pulses with τ = 5 ns (left) and τ = 50 ns (right) on log-scale. Fluorescence counts versus τ for 85Rb and 87Rb are shown in (c) and (d), respectively. Red arrows mark the expected location of τ, where multiple square pulses with Trep = 2τ period and coherent phases resonantly drive hyperfine depumping transitions to degrade the MOT performance.
    Yuzhuo Wang, Yizun He, Lingjing Ji, Jiangyong Hu, Xing Huang, Yudi Ma, Liyang Qiu, Kaifeng Zhao, Saijun Wu. Intense, wideband optical waveform generation by self-balanced amplification of fiber electro-optical sideband modulation[J]. Chinese Optics Letters, 2022, 20(11): 111401
    Download Citation