
Yuzhuo Wang, Yizun He, Lingjing Ji, Jiangyong Hu, Xing Huang, Yudi Ma, Liyang Qiu, Kaifeng Zhao, Saijun Wu, "Intense, wideband optical waveform generation by self-balanced amplification of fiber electro-optical sideband modulation," Chin. Opt. Lett. 20, 111401 (2022)
- Chinese Optics Letters
- Vol. 20, Issue 11, 111401 (2022)
Abstract
Keywords
I. Introduction
Optical control of atomic motion is traditionally accomplished by weakly dressing atoms in their ground-state manifolds, such as laser cooling, atom interferometry, and ion-based quantum information processing[
Efforts have been made to generate intense, coherent optical waveforms with GHz modulation bandwidth for atomic physics applications[
In this work, we introduce a simple method to achieve intense, wideband programmable optical waveforms with substantially suppressed noise associated with ASE and SPM effects. The method starts with phase-modulating a CW laser with fEOM at a microwave carrier frequency
Sign up for Chinese Optics Letters TOC. Get the latest issue of Chinese Optics Letters delivered right to you!Sign up now
In the following, we first outline the operation principle of the amplified optical waveform generation system. We then detail the performance of our Rb laser system and present an example application of the system for cooling and trapping with interleaved nanosecond pulses.
2. Methods
2.1. Sideband modulation
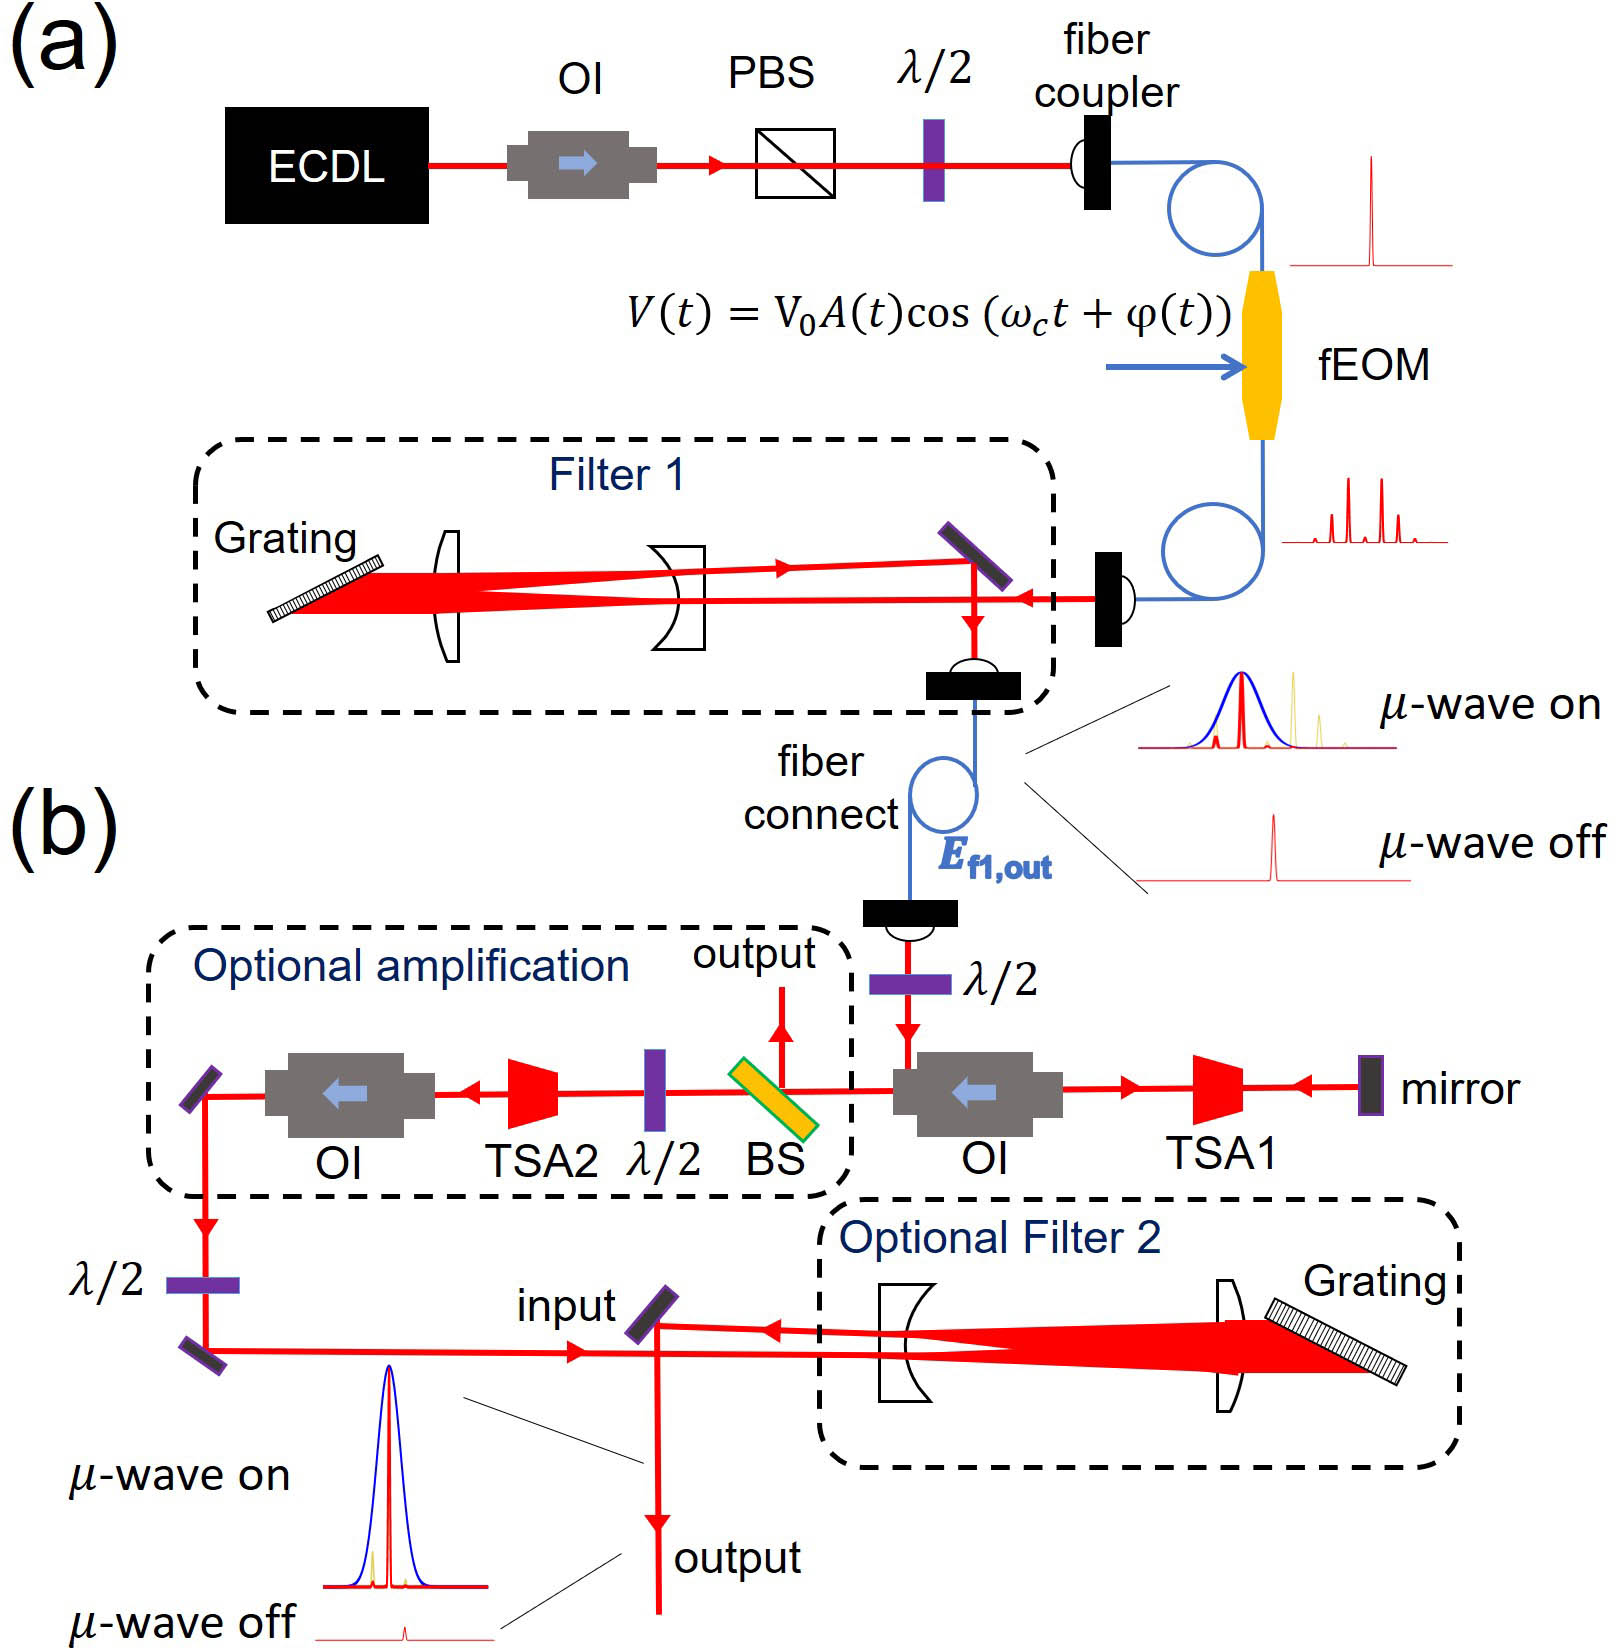
The setup of our laser system is schematically illustrated in Fig. 1. A frequency-stabilized CW laser (an external-cavity-diode laser, ECDL) is phase-modulated through fEOM by an amplitude and phase-modulated microwave signal
![]()
Figure 1.Schematic setup of the waveform generation system. The spectrum of the optical waveform is illustrated at each stage of the amplified modulation. (a) Schematic diagram of fEOM modulation and first optical filtering. CW laser from ECDL is modulated by fEOM with a programmable microwave signal. The fEOM output is collimated into a suitable size and filtered by grating diffraction before being coupled into a single-mode fiber. (b) High-gain optical amplification. TSA1 is seeded from the side port of an optical isolator for double-pass amplification. Optional Filter2 serves to remove the optical carrier from the final output. ECDL, external cavity diode laser; OI, optical isolator; PBS, polarization beamsplitter; BS, beamsplitter.
As described by the second line of Eq. (1), the phase-modulated output can be decomposed into an array of optical sidebands, with the
The desired
2.2. The first optical filter
We send the fEOM output
Here,
As such, the resulting output
2.3. Self-balanced amplification
At near-infrared wavelengths, to avoid photo-refractive damage, the fEOM throughput is limited to less than tens of milliwatts. With a sideband modulation efficiency limited to
In this work, we realize that for a high enough microwave modulation carrier frequency
2.4. The second optical filter
With the microwave carrier frequency
3. The Rubidium Laser System
So far, we have outlined the general operation principle and key elements of the amplified laser system. In the following, we provide additional details of the laser system designed for cooling and coherent manipulation of
We heat the fEOM (EOSpace, Model PM-0S5-20-PFA-PFA-780-UL) to
As detailed in the Supplementary Material, the spectrum density of the coherent
3.1. Accurate waveform generation
The microwave amplitudes
Typical beat note measurements for the
![]()
Figure 2.Characterization of chirped pulses from TSA2 output without Filter2. The frequency sweep range Δf is 1 GHz and 4 GHz for data in (a) and (b), respectively. The heterodyning beat notes are given in (i), from which we derive the (ii) spectrogram and (iv) in-phase quadrature Re(E−1). As in (iii), due to the self-balanced amplification, the total output power stays approximately unchanged, with a fractional deviation <15% during the full-pulse modulation.
To further confirm the accuracy of the modulated sideband, we use the known target waveform phase
![]()
Figure 3.Accurate phase modulation of TSA2 output. The heterodyning beat notes in (a) are digitally demodulated as described in the text to obtain the time-dependent phase ϕ(t) in (b). The complex data is presented in (c) the phasor diagram.
3.2. Interleaved cooling and trapping with (in)coherent nanosecond pulses
Beyond
![]()
Figure 4.(a) Level diagram and cooling related transitions on the 87Rb (left) and 85Rb (right) D2 line. (b) Spectragraphs derived from heterodyning beat notes of interleaved nanosecond pulses with τ = 5 ns (left) and τ = 50 ns (right) on log-scale. Fluorescence counts versus τ for 85Rb and 87Rb are shown in (c) and (d), respectively. Red arrows mark the expected location of τ, where multiple square pulses with Trep = 2τ period and coherent phases resonantly drive hyperfine depumping transitions to degrade the MOT performance.
Here, we demonstrate the wideband performance of the system by magneto-optical trapping (MOT) with interleaved nanosecond pulses. In particular, microwave pulses with duration
The amplified
The amplified nanosecond pulses with a total power of 700 mW are sent to a double-MOT system, where a 2D-pulse source MOT feeds a second MOT in the standard 3D configuration. After loading the second MOT for 1 s, we successively take two fluorescence images for
4. Summary and Outlook
Novel research scenarios in atomic physics and quantum optics[
In this work, we have explored a self-balancing technique in amplifying sideband modulation to suppress signals. Sub-milliwatt signals from an fEOM are amplified into watt-level output. The ASE noises are suppressed to a level similar to those achieved in constant seeding[
References
[1] H. J. Metcalf, P. van der Straten. Laser Cooling and Trapping(1999).
[2] R. Blatt, D. Wineland. Entangled states of trapped atomic ions. Nature, 453, 1008(2008).
[3] A. D. Cronin, D. E. Pritchard. Optics and interferometry with atoms and molecules. Rev. Mod. Phys., 81, 1051(2009).
[4] J. Mizrahi, C. Senko, B. Neyenhuis, K. G. Johnson, W. C. Campbell, C. W. S. Conover, C. Monroe. Ultrafast spin-motion entanglement and interferometry with a single atom. Phys. Rev. Lett., 110, 203001(2013).
[5] J. F. Barry, D. J. Mccarron, E. B. Norrgard, M. H. Steinecker, D. Demille. Magneto-optical trapping of a diatomic molecule. Nature, 512, 286(2014).
[6] S. A. Moses, K. G. Johnson, C. Monroe. Demonstration of two-atom entanglement with ultrafast optical pulses. Phys. Rev. Lett., 119, 230501(2017).
[7] I. Kozyryev, L. Baum, K. Matsuda, B. L. Augenbraun, L. Anderegg, A. P. Sedlack, J. M. Doyle. Sisyphus laser cooling of a polyatomic molecule. Phys. Rev. Lett., 118, 173201(2017).
[8] J. Thom, G. Wilpers, E. Riis, A. G. Sinclair. Accurate and agile digital control of optical phase, amplitude and frequency for coherent atomic manipulation of atomic systems. Opt. Express, 21, 18712(2013).
[9] X. Miao, E. Wertz, M. G. Cohen, H. Metcalf. Strong optical forces from adiabatic rapid passage. Phys. Rev. A, 75, 011402(2007).
[10] A. M. Jayich, A. C. Vutha, M. T. Hummon, J. V. Porto, W. C. Campbell. Continuous all-optical deceleration and single-photon cooling of molecular beams. Phys. Rev. A, 89, 023425(2014).
[11] D. Heinrich, M. Guggemos, M. Guevara-Bertsch, M. I. Hussain, C. Roos, R. Blatt. Ultrafast coherent excitation of a 40Ca+ ion. New J. Phys., 21, 073017(2019).
[12] X. Long, S. S. Yu, A. M. Jayich, W. C. Campbell. Suppressed spontaneous emission for coherent momentum transfer. Phys. Rev. Lett., 123, 033603(2019).
[13] Y. He, L. Ji, Y. Wang, L. Qiu, J. Zhao, Y. Ma, X. Huang, S. Wu, D. E. Chang. Atomic spin-wave control and spin-dependent kicks with shaped sub-nanosecond pulses. Phys. Rev. Res., 2, 043418(2020).
[14] C. P. Koch, M. Shapiro. Coherent control of ultracold photoassociation. Chem. Rev., 112, 4928(2012).
[15] J. L. Carini, S. Kallush, R. Kosloff, P. L. Gould. Enhancement of ultracold molecule formation using shaped nanosecond frequency chirps. Phys. Rev. Lett., 115, 173003(2015).
[16] M. O. Scully. Single photon subradiance: quantum control of spontaneous emission and ultrafast readout. Phys. Rev. Lett., 115, 243602(2015).
[17] G. Facchinetti, S. D. Jenkins, J. Ruostekoski. Storing light with subradiant correlations in arrays of atoms. Phys. Rev. Lett., 117, 243601(2016).
[18] Y. He, L. Ji, Y. Wang, L. Qiu, J. Zhao, Y. Ma, X. Huang, S. Wu, D. E. Chang. Geometric control of collective spontaneous emission. Phys. Rev. Lett., 125, 213602(2020).
[19] D. Goswami. Optical pulse shaping approaches to coherent control. Phys. Rep., 374, 385(2003).
[20] S. Zhdanovich, E. A. Shapiro, M. Shapiro, J. W. Hepburn, V. Milner. Population transfer between two quantum states by piecewise chirping of femtosecond pulses: theory and experiment. Phys. Rev. Lett., 100, 103004(2008).
[21] Y. Ma, X. Huang, X. Wang, L. Ji, Y. He, L. Qiu, J. Zhao, Y. Wang, S. Wu. Precise pulse shaping for quantum control of strong optical transitions. Opt. Express, 28, 17171(2020).
[22] C. E. Rogers, P. L. Gould. Nanosecond pulse shaping at 780 nm with fiber-based electro-optical modulators and a double-pass tapered amplifier. Opt. Express, 24, 2596(2016).
[23] B. Kaufman, T. Paltoo, T. Grogan, T. Pena, J. P. S. John, M. J. Wright. Pulsed, controlled, frequency-chirped laser light at GHz detuings for atomic physics experiments. Appl. Phys. B, 123, 58(2017).
[24] X. Wu, F. Zi, J. Dudley, R. J. Bilotta, P. Canoza, H. Müller. Multiaxis atom interferometry with a single-diode laser and a pyramidal magneto-optical trap. Optica, 4, 1545(2017).
[25] B. S. Clarke, P. L. Gould. Amplification of arbitrary frequency chirps of pulsed light on nanosecond timescales(2021).
[26] C. D. Macrae, K. Bongs, M. Holynski. Optical frequency generation using fiber Bragg grating filters for applications in portable quantum sensing. Opt. Lett., 46, 1257(2021).
[27] Y. He, Q. Cai, L. Ji, Z. Fang, Y. Wang, L. Qiu, L. Zhou, S. Wu, S. Grava, D. E. Chang. Unraveling disorder-induced optical dephasing in an atomic ensemble(2021).
[28] V. Bolpasi, W. V. Klitzing. Double-pass tapered amplifier diode laser with an output power of 1 W for an injection power of only 200 µW. Rev. Sci. Instrum., 81, 113108(2010).
[29] A. F. Forrest, M. Krakowski, P. Bardella, M. A. Cataluna. Double-pass amplification of picosecond pulses with a tapered semiconductor amplifier. Opt. Express, 27, 30752(2019).
[30] G. P. Agrawal, N. A. Olsson. Self-phase modulation and spectral broadening of optical pulses in semiconductor laser amplifiers. IEEE J. Quantum Electron., 25, 2297(1989).
[31] M. Y. Hong, Y. H. Chang, A. Dienes, J. P. Heritage, P. J. Delfyett. Subpicosecond pulse amplification in semiconductor laser amplifiers: theory and experiment. IEEE J. Quantum Electron., 30, 1122(1994).
[32] F. C. Cruz, M. C. Stowe, J. Ye. Tapered semiconductor amplifiers for optical frequency combs in the near infrared. Opt. Lett., 31, 1337(2006).
[33] P. P. Baveja, D. N. Maywar, A. M. Kaplan, G. P. Agrawal. Self-phase modulation in semiconductor optical amplifiers: impact of amplified spontaneous emission. IEEE J. Quantum Electron., 46, 1396(2010).
[34] H. Luo, K. Li, D. Zhang, T. Gao, K. Jiang. Multiple side-band generation for two-frequency components injected into a tapered amplifier. Opt. Lett., 38, 1161(2013).
[35] Z. X. Meng, Y. H. Li, Y. Y. Feng. Two-frequency amplification in a semiconductor tapered amplifier for cold atom experiments. Chin. Phys. B, 27, 094201(2018).
[36] More specifically, a ωM bound can be evaluated by considering the minimal distance between the desired sideband and other sidebands. The 4 GHz modulation bandwidth in this work considers a minimal frequency separation equal to half the bandwidth itself.
[37] J. D. White, R. E. Scholten. Compact diffraction grating laser wavemeter with sub-picometer accuracy and picowatt sensitivity using a webcam imaging sensor. Rev. Sci. Instrum., 83, 113104(2012).
[38] P. Palittapongarnpim, A. Macrae, A. I. Lvovsky. Note: a monolithic filter cavity for experiments in quantum optics. Rev. Sci. Instrum., 83, 066101(2012).
[39] Y. Wang, J. Zhao, X. Huang, L. Qiu, L. Ji, Y. Ma, Y. He, J. P. Sobol, S. Wu. Imaging moving atoms by holographically reconstructing the dragged slow light(2021).
[40] H. Wallis, W. Ertmer. Broadband laser cooling on narrow transitions. J. Opt. Soc. Am. B, 6, 2211(1989).
[41] A. Dunning, R. Gregory, J. Bateman, M. Himsworth, T. Freegarde. Interferometric laser cooling of atomic rubidium. Phys. Rev. Lett., 115, 073004(2015).
[42] M. Weitz, T. W. Hänsch. Frequency-independent laser cooling based on interferometry. Europhys. Lett., 49, 302(2000).


Set citation alerts for the article
Please enter your email address

© Copyright 2018-2021 | Chinese Laser Press. All Rights Reserved 沪ICP备15018463号-20