
Sheng-hui YANG, Yong-jun ZHENG, Xing-xing LIU, Tian-gang ZHANG, Xiao-shuan ZHANG, Li-ming XU. Cabernet Gernischt Maturity Determination Based on Near-Ground Multispectral Figures by Using UAVs[J]. Spectroscopy and Spectral Analysis, 2021, 41(10): 3220
- Spectroscopy and Spectral Analysis
- Vol. 41, Issue 10, 3220 (2021)
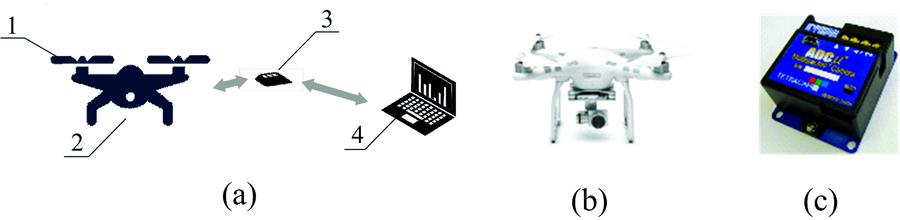
Fig. 1. The acquisition system based on a multispectral camera
(a): The composition of the acquisition system; (b): DJI Phantom; (c): ADC Micro
1: DJI Phantom, a quad-rotor UAV; 2: ADC Micro, a multispectral camera; 3: an SD card with 16G storage; 4: Computer
(a): The composition of the acquisition system; (b): DJI Phantom; (c): ADC Micro
1: DJI Phantom, a quad-rotor UAV; 2: ADC Micro, a multispectral camera; 3: an SD card with 16G storage; 4: Computer
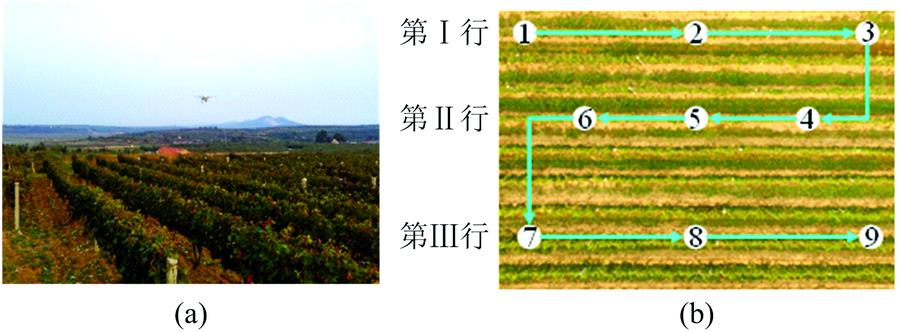
Fig. 2. The acquisition of multispectral images in fields
(a): Experimental site; (b): Sampling scheme
(a): Experimental site; (b): Sampling scheme
Fig. 3. The acquired multispectral images
(a): An image example (1); (b): An image example (2);(c): An image example (3); (d): An image example (4)
(a): An image example (1); (b): An image example (2);(c): An image example (3); (d): An image example (4)
Fig. 4. The examples of the images with R, G and NIR components processed by PixelWrench2 x64
(a): The image with R component;(b): The image with G component;(c): The image with Near-Infrared (NIR) conponent
(a): The image with R component;(b): The image with G component;(c): The image with Near-Infrared (NIR) conponent
Fig. 5. The results of R, G and NIR components
(a): R, G and NIR components in local areas;(b): R, G and NIR components in entire areas
(a): R, G and NIR components in local areas;(b): R, G and NIR components in entire areas
Fig. 6. The portable sugar meter, PAL-1, and its real measurement
(a): A portable sugar meter, PAL-1;(b): Measuring total sugar of grape juice by using PAL-1
(a): A portable sugar meter, PAL-1;(b): Measuring total sugar of grape juice by using PAL-1
Fig. 7. The changing relation between each component and date
(a): The changing relation between R component and date; (b): The changing relation between G component and date;(c): The changing relation between NIR component and date
(a): The changing relation between R component and date; (b): The changing relation between G component and date;(c): The changing relation between NIR component and date
Fig. 8. The regression modelling between the local R component of the multispectral images and total sugar
(a): The linear model between the local R component of the multispectral images and total sugar;(b): The logarithmic model between the local R component of the multispectral images and total sugar
(a): The linear model between the local R component of the multispectral images and total sugar;(b): The logarithmic model between the local R component of the multispectral images and total sugar
|
Table 1. The component results of local and entire areas
|
Table 2. The total sugar of grape juice of the model set
|
Table 3. The regression of each colour component
|
Table 4. The results of the regression analysis between the local R component of the multispectral images and total sugar
|
Table 5. The comparison between the total sugar of the validation set and that of the model prediction results

Set citation alerts for the article
Please enter your email address
© Copyright 2018-2021 | Chinese Laser Press. All Rights Reserved 沪ICP备15018463号-20