
Changming Xia, Guiyao Zhou. Progress and Prospect of Microstructured Optical Fibers[J]. Laser & Optoelectronics Progress, 2019, 56(17): 170603
- Laser & Optoelectronics Progress
- Vol. 56, Issue 17, 170603 (2019)
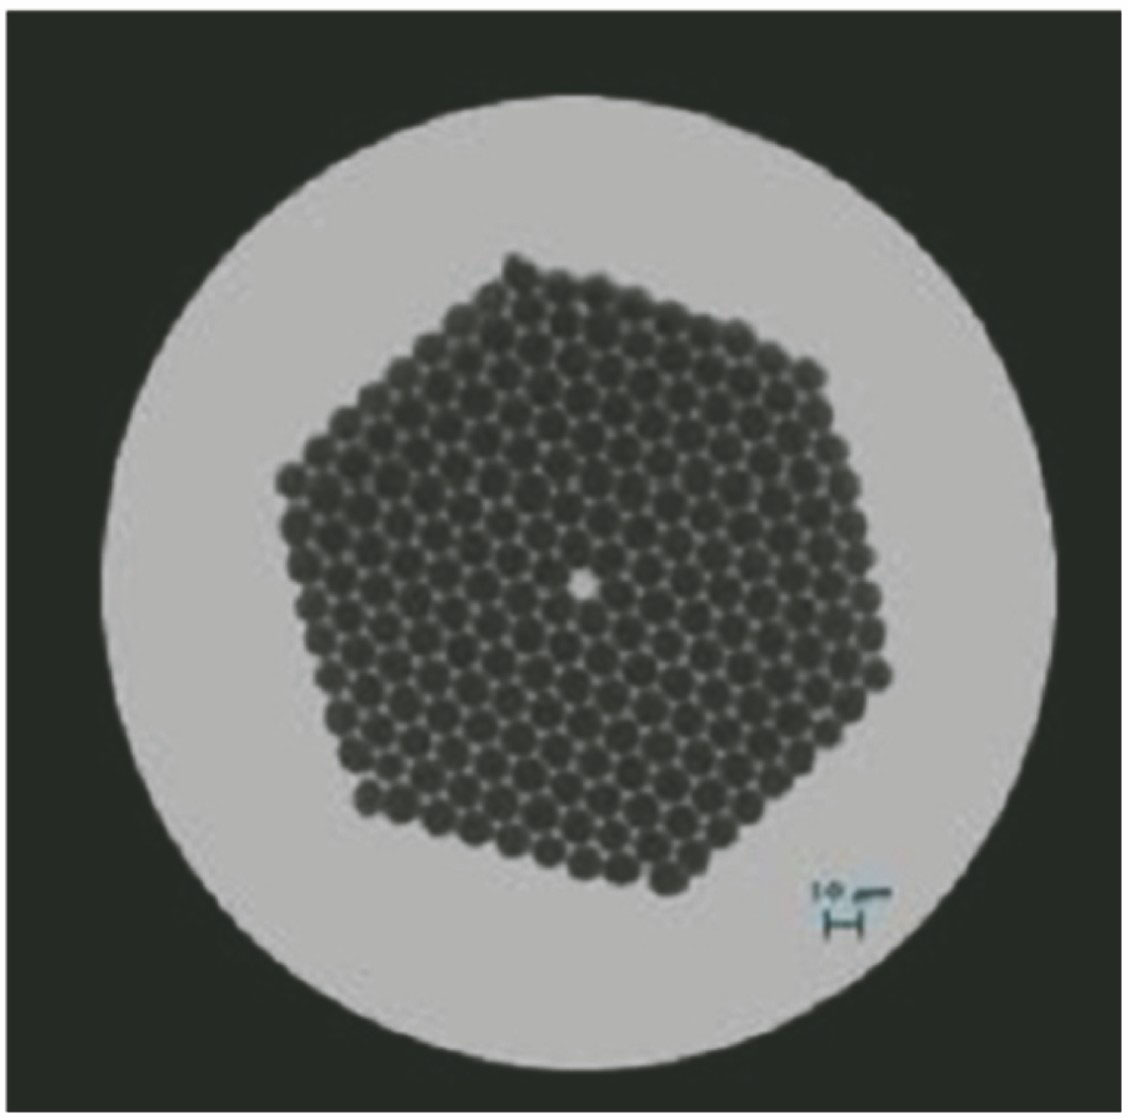
Fig. 1. Cross-section of solid core microstructured optical fiber
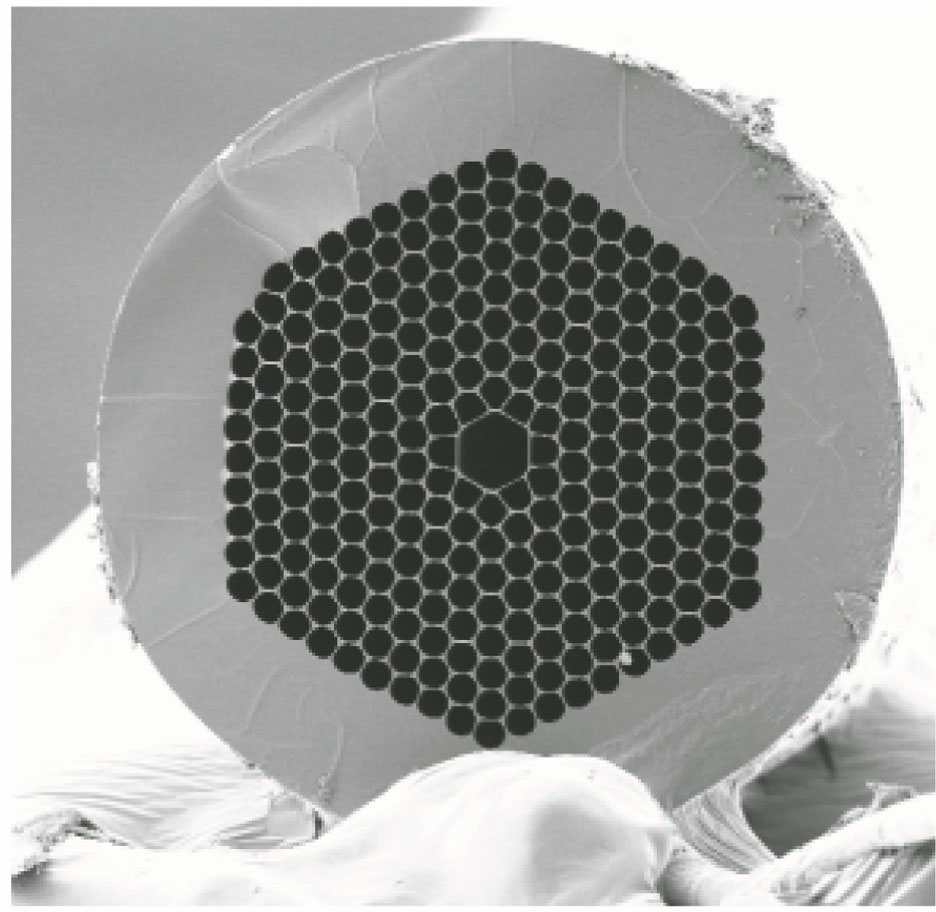
Fig. 2. Cross-section of hollow core photonic bandgap microstructured optical fiber
Fig. 3. Light guiding principle in microstructured optical fiber with hollow core photonic bandgap
Fig. 4. Cross-sections of microstructured optical fiber with hollow core photonic bandgap[35]. (a) 3 cores; (b) 7 cores; (c) 19 cores; (d) 37 cores
Fig. 5. Cross-section of hollow core antiresonant fiber
Fig. 6. Light guiding principles of hollow core antiresonant fiber[31]. (a) Antiresonant; (b) resonant
Fig. 7. Flow chart of microstructured optical fiber fabrication by stack and draw method. (a) Fabrication of fiber preform by stack and draw method; (b) drawing of fiber cane; (c) drawing of fiber
Fig. 8. Extrusion of microstructured optical fibers[44]
Fig. 9. Microstructured optical fibers fabricated by extrusion method and supercontinuum spectrum[40]
Fig. 10. Tellurite MOF fabricated by extrusion process[45]. (a) Cross-section of die used for extrusion; (b) tellurite preform; (c) scanning electron microscope image of tellurite PCF; (d) optical transmission view of tellurite PCF
Fig. 11. SF6 microstructured optical fibers fabricated by extrusion process and supercontinuum spectrum[44]
Fig. 12. Diagram of sulphide glass microstructured optical fibers fabricated by mechanical drilling and photos of sulphide glass rods and preforms[46]. (a) Equipment of mechanical drilling; (b) sulphide glass rods; (c)-(e) prepared preforms
Fig. 13. 3D printing technology based glass with high precision from Massachusetts Institute of Technology[47]
Fig. 14. Microstructured optical fibers from 3D printed SBP preform and transmission of light[50]. (a) 630 nm guided light; (b) 515 nm guided light; (c) white light; (d) schematic of setup used for guidance test
Fig. 15. 3D printed PMMA microstructured optical fibers and photos of preforms and cross-section of fiber[53]. (a) Design of PMMA hollow core fiber preform; (b) 3D printed hollow core fiber preform; (c) cross-section of PMMA hollow core fiber
Fig. 16. High-nonlinearity fibers and supercontinuum spectrum[62]
Fig. 17. Large mode area Yb3+doped photonic crystal fiber rod and laser slope efficiency[73]
Fig. 18. (a) Cross section of Tm3+ doped photonic crystal fiber rod and laser and (b) amplification slope efficiencies[75]
Fig. 19. Slope efficiencies and cross-section of Tm3+ doped photonic crystal fiber[76]
Fig. 20. (a) SEM image of Er3+ doped photonic crystal fiber cross section and (b) superfluorescence spectrum varying with fiber length[77]
Fig. 21. Cross-section of Yb3+ doped photonic crystal fiber with large mode area[78]. (a) Whole image; (b) locally enlarged image
Fig. 22. Phase wavefront and field intensity distribution of OAM beams (l=3). (a) Spiral phase wavefront; (b) optical field intensity distribution
Fig. 23. Modes supported by proposed C-PCF and wavefront distributions[104]. Field intensities of (a) HE13,1, (b) EH8,1, (c) HE6,1, and (d) EH1,1 modes; wavefronts of (e) OAM12,1, (f) OAM9,1, (g) OAM5,1, and (h) OAM2,1 modes
Fig. 24. Structure, transmission spectrum and loss of low loss hollow core antiresonant fiber[137]. (a) Structure; (b) transmission spectrum; (c) loss


Set citation alerts for the article
Please enter your email address

© Copyright 2018-2021 | Chinese Laser Press. All Rights Reserved 沪ICP备15018463号-20