
Xiang Li, Jingrou Tan, Kaimin Zheng, Labao Zhang, Lijian Zhang, Weiji He, Pengwei Huang, Haochen Li, Biao Zhang, Qi Chen, Rui Ge, Shuya Guo, Tao Huang, Xiaoqing Jia, Qingyuan Zhao, Xuecou Tu, Lin Kang, Jian Chen, Peiheng Wu, "Enhanced photon communication through Bayesian estimation with an SNSPD array," Photonics Res. 8, 637 (2020)
- Photonics Research
- Vol. 8, Issue 5, 637 (2020)
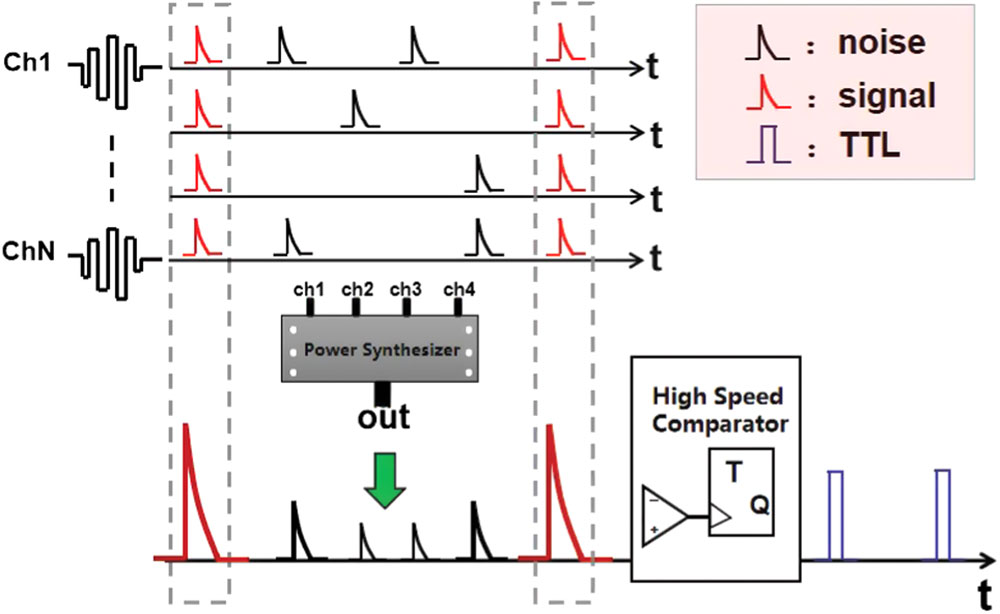
Fig. 1. Working principle of array SNSPD multi-channel simultaneous output.
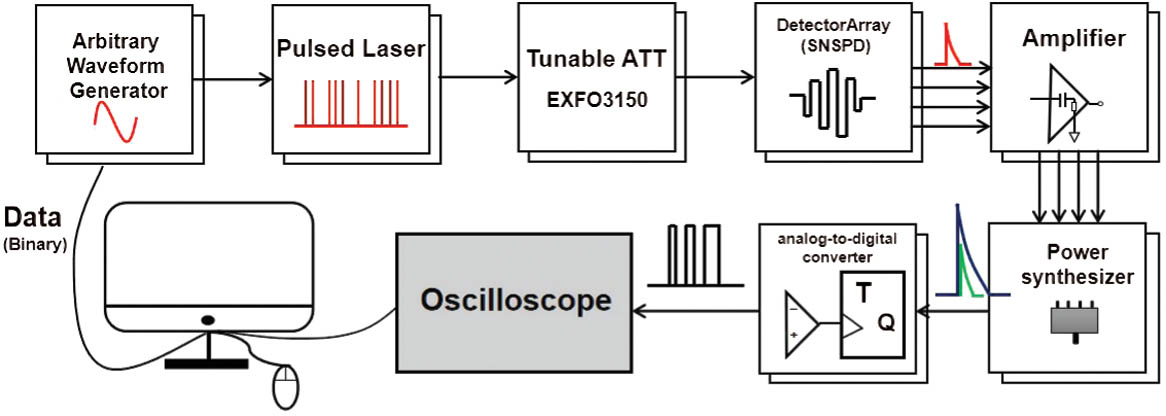
Fig. 2. Schematic diagram of simulated optical communication system.
Fig. 3. Yellow waveform is the synchronization signal input from an arbitrary waveform generator to a pulsed laser, the higher amplitude pulse on the left is the head of the transmitted data (easy to compare), the green waveform is output of the SNSPD that detects photons with data information and outputs electric pulses that rise rapidly and then decay exponentially (with a delay of about 100 ns), and the blue waveform is the TTL signal of SNSPD output waveform after the shaping module.
Fig. 4. Intensity comparison diagram of each pixel. On the left is the transmitted image intensity, and on the right is the original image intensity.
Fig. 5. Picture transmitted through the system (left) and the original picture (right).
Fig. 6. Variation of BER with light intensity at different transmission frequencies. The transmission speeds of the black, red, blue, and pink curves were 10, 20, 40, and 50 Mbps, respectively. The detector was a four-pixel array SNSPD, detection efficiency was 50% at 1550 nm band, and the recovery time of the nanowires was 50 ns.
Fig. 7. Variation curves of posterior probabilities P ( 1 | k ) P ( 0 | k ) μ = 1
Fig. 8. BER variation curve with the intensity of light obtained by counting the response amplitudes of different pixels.


Set citation alerts for the article
Please enter your email address

© Copyright 2018-2021 | Chinese Laser Press. All Rights Reserved 沪ICP备15018463号-20