• Journal of Geographical Sciences
  • Vol. 30, Issue 9, 1507 (2020)
Wenbo ZHU*, Jingjing ZHANG, Yaoping CUI, and Lianqi ZHU
Author Affiliations
  • College of Environment & Planning, Henan University, Kaifeng 475004, Henan, China
  • show less
    DOI: 10.1007/s11442-020-1796-6 Cite this Article
    Wenbo ZHU, Jingjing ZHANG, Yaoping CUI, Lianqi ZHU. Ecosystem carbon storage under different scenarios of land use change in Qihe catchment, China[J]. Journal of Geographical Sciences, 2020, 30(9): 1507 Copy Citation Text show less
    Location of the Qihe catchment in China and its digital elevation model (DEM)
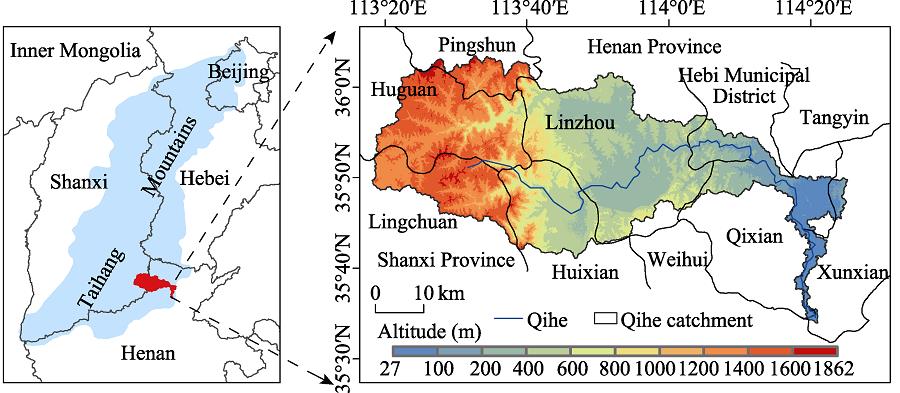
    Fig. 1. Location of the Qihe catchment in China and its digital elevation model (DEM)
    Land use map of 2005 (a) and 2015 (b) as well as simulated map of 2015 (c) in the Qihe catchment, China
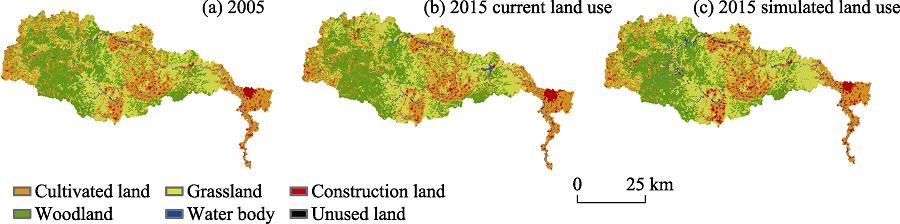
    Fig. 2. Land use map of 2005 (a) and 2015 (b) as well as simulated map of 2015 (c) in the Qihe catchment, China
    The simulated results of land use in 2025 under different scenarios in the Qihe catchment, China
    Fig. 3. The simulated results of land use in 2025 under different scenarios in the Qihe catchment, China
    Scenario comparison of land use changes in 2015-2025 in the Qihe catchment, China
    Fig. 4. Scenario comparison of land use changes in 2015-2025 in the Qihe catchment, China
    Carbon storage, carbon density and the change of carbon density along with the increase of altitude in 2005, 2015 and different scenarios of 2025 in the Qihe catchment, China
    Fig. 5. Carbon storage, carbon density and the change of carbon density along with the increase of altitude in 2005, 2015 and different scenarios of 2025 in the Qihe catchment, China
    Spatial distribution of carbon density and carbon density changes in 2005, 2015 and different scenarios of 2025 in the Qihe catchment, China
    Fig. 6. Spatial distribution of carbon density and carbon density changes in 2005, 2015 and different scenarios of 2025 in the Qihe catchment, China
    TypeCultivated landWoodlandGrasslandWater bodyConstruction landUnused land
    Q10.70.70.70.80.90.6
    Q20.90.70.70.80.90.5
    Q30.70.80.80.90.90.5
    Table 1.

    The ELAS of all land use types under different scenarios

    TypeCi-aboveCi-belowCi-soil
    Cultivated land4.020.76105.14
    Woodland55.7412.14174.97
    Grassland0.392.4696.89
    Water body0.04064.03
    Construction land0.01057.63
    Unused land0.01058.89
    Table 2.

    Carbon density of different land use types in the Qihe catchment, China (t/ha)

    EncodeCultivated landWoodlandGrasslandWater bodyConstruction landUnused land
    Beta coefficientExp(B)Beta coefficientExp(B)Beta coefficientExp(B)Beta coefficientExp(B)Beta coefficientExp(B)Beta coefficientExp(B)
    Constant2.14398.5329-4.88520.0076-1.93610.1443-3.77410.02300.23811.2688-13.18270
    sc1gr00.00071.00070.00141.0014-0.00140.9986-0.00230.9977--0.00171.0017
    sc1gr1-0.13330.87520.09801.10290.03881.0395-0.08960.9143-0.01130.98880.07381.0766
    sc1gr20.00041.0004-0.00020.9998--------
    sc1gr3-0.01500.9850.01051.0106-0.02110.97910.15321.1656----
    sc1gr40.00841.00850.06381.0659-0.08250.9209-0.22950.79490.19631.2169--
    sc1gr5-0.03250.96800.10331.1088--------
    sc1gr6--0.00011.0001--------
    sc1gr7-0.00050.99950.00021.00020.00041.00040.00021.0002-0.00900.9911--
    sc1gr8----0.00011.0001------
    sc1gr90.00011.0001----0.00011.0001----
    ROC value0.8100.8480.7110.8430.9560.825
    Table 3.

    Results of logistic regression for different land use types in 2005 in the Qihe catchment, China

    20152005
    Cultivated landWoodlandGrasslandWater bodyConstruction landUnused landTotalTransferred-in Total
    Cultivated land474223262.56655.51257.751714.5060312.2512890.25
    Woodland6169.551878.758196.75231.7567.54.566548.7514670
    Grassland1211412136.553237.5591.75299.252.2578381.2525143.75
    Water body2468.25623.25762.751404.75155.2505414.254009.5
    Construction land4475.25391.5555.751176499.252.25120415541.75
    Unused land913.56.7502.25233.531.5
    Total7265868306694153603873811222731-
    Transferred-out Total2523616427.2516177.52198.252238.759-62286.75
    Table 4.

    Land use transfer matrix for 2005-2015 (ha) in the Qihe catchment, China

    Time periodSignificantly decreased(≤-20 t/ha)Basically unchanged(-20 to 20 t/ha)Significantly increased (≥20 t/ha)
    Raster gridProportion (%)Raster gridProportion (%)Raster gridProportion (%)
    2005-201534193.459520596.114300.43
    2015-2025 (Q1)15991.619734098.271150.12
    2015-2025 (Q2)5950.609795898.895010.51
    2015-2025 (Q3)1700.179779598.7310891.10
    Table 5.

    Statistics on carbon density changes during 2005-2015 and 2015-2025 under different scenarios in the Qihe catchment, China

    Wenbo ZHU, Jingjing ZHANG, Yaoping CUI, Lianqi ZHU. Ecosystem carbon storage under different scenarios of land use change in Qihe catchment, China[J]. Journal of Geographical Sciences, 2020, 30(9): 1507
    Download Citation