Wenbo ZHU, Jingjing ZHANG, Yaoping CUI, Lianqi ZHU. Ecosystem carbon storage under different scenarios of land use change in Qihe catchment, China[J]. Journal of Geographical Sciences, 2020, 30(9): 1507
Copy Citation Text
Regional land use change is the main cause of the ecosystem carbon storage changes by affecting emission and sink process. However, there has been little research on the influence of land use changes for ecosystem carbon storage at both temporal and spatial scales. For this study, the Qihe catchment in the southern part of the Taihang Mountains was taken as an example; its land use change from 2005 to 2015 was analyzed, the Markov-CLUE-S composite model was used to predict land use patterns in 2025 under natural growth, cultivated land protection and ecological conservation scenario, and the land use data were used to evaluate ecosystem carbon storage under different scenarios for the recent 10-year interval and the future based on the carbon storage module of the InVEST model. The results show the following: (1) the ecosystem carbon storage and average carbon density of Qihe catchment were 3.16×10⁷ t and 141.9 t/ha, respectively, and decreased by 0.07×10⁷ t and 2.89 t/ha in the decade evaluated. (2) During 2005-2015, carbon density mainly decreased in low altitude areas. For high altitude area, regions with increased carbon density comprised a similar percentage to regions with decreased carbon density. The significant increase of the construction areas in the middle and lower reaches of Qihe and the degradation of upper reach woodland were core reasons for carbon density decrease. (3) For 2015-2025, under natural growth scenario, carbon storage and carbon density also significantly decrease, mainly due to the decrease of carbon sequestration capacity in low altitude areas; under cultivated land protection scenario, the decrease of carbon storage and carbon density will slow down, mainly due to the increase of carbon sequestration capacity in low altitude areas; under ecological conservation scenario, carbon storage and carbon density significantly increase and reach 3.19×10⁷ t and 143.26 t/ha, respectively, mainly in regions above 1100 m in altitude. Ecological conservation scenario can enhance carbon sequestration capacity but cannot effectively control the reduction of cultivated land areas. Thus, land use planning of research areas should consider both ecological conservation and cultivated land protection scenarios to increase carbon sink and ensure the cultivated land quality and food safety.
Increasing carbon sequestration of terrestrial ecosystem can effectively reduce CO2 concentration in the air (Schimel et al., 2001; Ji et al., 2008; Piao et al., 2009; Fang et al., 2015; Dai et al., 2016a). Land use change is one of the most important drivers that lead to the change of the terrestrial ecosystem carbon storage, and its contribution to the increase of CO2 concentration in the air is only inferior to the fossil fuel combustion (Foley et al., 2005; Houghton et al., 2012; Baumann et al., 2017). Thus, evaluating and predicting the effect of regional land use change on ecosystem carbon storage and exploring optimized methods for land use change to alter ecosystem carbon storage are significant for increasing the capacity of regional ecosystem service, and mitigating emission of carbon.
Previous research has shown that deforestation in tropical areas can cause terrestrial ecosystem carbon storage decrease globally (Navin et al., 2007; Baccini et al., 2012; Houghton, 2012; Gutierrez-Velez and Pontius, 2012; Nogueira et al., 2018); conversion of farmland to construction land and ‘Grain for Green’ Program affect carbon emission at national and regional levels (Laganière et al., 2010; Zhao et al., 2013; Tao et al., 2015; Lai et al., 2016; Liao et al., 2016; Han et al., 2017). Some studies have simulated future scenarios of land use change and their effects on carbon storage in urban and oasis ecosystems based on models (Jiang et al., 2017; Liang et al., 2017) to optimize land use pattern in terms of low carbon emission (Wang and Zeng, 2015), and these studies have achieved the prediction for regional ecosystem carbon storage and the spatial visualization of the prediction results. According to previous studies, the effect of land use change on ecosystem carbon storage is mainly decided by ecosystem types and how land use types are transformed, and related research will have practical significance for managing future regional ecosystem and providing suggestions for optimizing land use structure with the objective of carbon balance. Catchment is a large complex system that comprises water resource, socio-economy and ecosystem, and has clear hierarchical structure and allomeric function, and determining how to trade off eco-environmental issues and socio-economic sustainable development in the perspective of catchment is an effective pathway for system synthesis (Zhang et al., 2018; Qian et al., 2018). Some researchers have previously evaluated spatiotemporal pattern of ecosystem carbon storage at catchment level and studied the effects of land use dynamics on carbon storage (Wang et al., 2013), but simulation research for future scenarios is still lacking. Conducting multiple scenarios analysis on future catchment land use changes and evaluating potential carbon storage can provide a scientific basis for catchment land use planning and decision making, and will contribute to the sustainable development of catchment ecosystem.
CLUE-S (Conversion of Land Use and its Effects at Small region extent) model is a typical empirical statistical model that treats the competition between different types of land use based on systems theory, simulates different land use types simultaneously, and produces a spatially explicit display of the simulation results. This model has been recognized as an excellent tool for simulating land use changes (Verburg et al., 2002; Jiang et al., 2015; Deng et al., 2016). However, the required module of land use amounts in this model needs to be calculated by other models or methods. The Markov model is good at predicting land use amount changes, and combining Markov with CLUE-S model can not only increase prediction precision for land use amount demand but also effectively simulate spatial variations of land use (Hu et al., 2013). The InVEST (Integrated Valuation of Ecosystem Services and Tradeoffs) model is based on land use data, and can conduct ecosystem carbon storage evaluation under multiple targets and scenarios (Dai et al., 2016b; Zhu et al., 2018). For this study, the Qihe catchment in the southern part of the Taihang Mountains was selected as an example; this catchment is located in the transitional zone between the North China Plain and south Taihang Mountains and has high topographic relief, various topographic types, and rich landscape patterns. However, due to continuous disturbance of human activities, land use types have changed considerably, which has led to significant changes of the ecosystem carbon storage capacity. Based on land use data of Qihe catchment from 2005 to 2015, for this paper, the Markov-CLUE-S composite model was used to predict land use patterns in the year 2025 under natural growth, cultivated land protection and ecological conservation scenarios, and the carbon storage module of InVEST was used to evaluate ecosystem carbon storage for the recent 10-year interval and future under different scenarios.
2 Data source and methodology
2.1 Overview of the study area
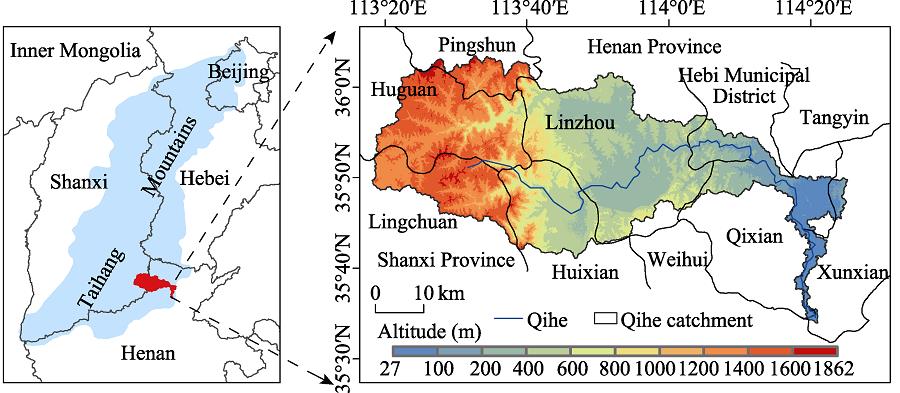
Qihe catchment falls on the eastern slope of the southern section of Taihang Mountains, between 13°17°-114°23°E and 35°32°-36°04°N, at east edge of the second step of Chinese terrain and connects with the North China Plain (Figure 1). Qihe is the tributary of Weihe, which belongs to the Haihe system; it originates from Lingchuan County of Shanxi Province, flows through Huguan County in Shanxi Province, Huixian City, Linzhou City, Hebi City, Qixian and Xunxian counties in Henan Province, meets Communist Canal in Liuzhuang of Xunxian County, and finally flows into Weihe. The length of Qihe is about 165 km, and its catchment area is 2227 km2. The altitude decreases from west to east with high topographic relief. The study area is traversed by rivers and valleys, its topographic types include basin, plain, hill and mountain, hills and mountains comprise 86% of the region (Zhang et al., 2018). The mean annual temperature is 11.9℃, and the mean annual precipitation is 573.7 mm, with a seasonal temperate semi-humid monsoon climate.
Figure 1.
Location of the Qihe catchment in China and its digital elevation model (DEM)
The vegetation of this area has significant vertical variation, according to the records of vertical zonation of vegetation in the southern section of Taihang Mountains (Kuang, 1991; Ru, 1993), from bottom to top, it presents low-mountain shrub and crop belt, low-to-middle mountain deciduous broad-leaved forest belt, middle-mountain coniferous and broad-leaved mixed forest belt, and hilltop shrub meadow belt, respectively.
2.2 Data sources and process
Land use data includes two terms, the first, from 2005, comes from National Earth System Science Data Sharing Infrastructure-Yellow River Downstream Scientific Data Center (http://www.geodata.cn/), and the second, from 2015, mainly comes from Landsat 8 OLI multispectral images (from Geospatial Data Cloud, http://www.gscloud.cn/), supplemented by 2005 and 2010 land use data (from Yellow River Downstream Scientific Data Center), DEM and its generated slope and aspect data. Artificial visual interpretation and classification were conducted by China Land Use Category System (Liu, 1997) to generate secondary class diagrams. We conducted a precision test on interpretation results with the help of high-resolution Google Earth images and validation samples were collected in the field, and it was verified that the interpretation precision reaches 86%, which satisfied the research requirements. Combining the secondary land use classification with the first, six land use types were obtained: cultivated land, woodland, grassland, water body, construction land and unused land.
The driving factors selected in this study for land use changes include topography, soil and accessible factors. Topographic factors include elevation, slope and aspect, which were extracted from DEM (from ASTER GDEM); soil factors include soil type, soil organic matter and total nitrogen concentration (from Yellow River Downstream Scientific Data Center) and were transferred into raster data; accessible factors include the distance to urban, rural residential settlements, rivers, provincial roads and county roads, which were calculated by Euclidean distance method. Urban and rural settlements were extracted from 2005 secondary land use class graph, data for rivers, provincial roads and county roads are from Yellow River Downstream Scientific Data Center. All vector data in this study are obtained from maps at a scale of 1:100,000, raster data are all in grid format, spatial resolution is 150 m and geographic coordinate system is WGS_1984_Albers.
2.3 Prediction of land use change based on Markov-CLUE-S composite model
(1) Markov-CLUE-S Composite Model
The operation of Markov-CLUE-S composite model includes the following five aspects:
1) Setting of restricted regions. According to the actual situations of Qihe catchment, for this study, restricted regions were not set. All land use types are allowed to be transferred.
2) Converting elastic coefficient and transfer matrix. Converting elastic coefficient represents the difficulty level of transferring certain land type into others. It can be expressed by parameter ELAS (0-1), a larger ELAS value indicates higher stability, and a smaller transformation probability. This study referred to 2005-2015 land use transformation probability, combined with 2015 land use simulation precision and Kappa coefficient, and multiple debugging sessions were conducted to achieve the best simulation result. Finally, we set converting elastic coefficients of cultivated land, woodland, grassland, water body, construction land and unused land as 0.7, 0.7, 0.7, 0.8, 0.9 and 0.6, respectively. Transfer matrix represents the transformation rules of all types of land, 1 represents “can be transferred”, and 0 means “cannot be transferred”. In this study, the value was set 1 for all the situations.
3) Calculation of land use demand. This study is based on land use data in 2005 and 2015, using the Markov model and linear interpolation to calculate land use demand for both simulated and selected years.
4) Spatial analysis. According to land use pattern and driving factor trait data, we employed Binary Logistic stepwise regression to diagnose the probability of certain land types occurring in each raster grid.
5) Model test. The ROC curve was used to verify logistic regression results. If the result is larger than 0.7, then selected driving factor has relatively good explanation capacity (Pontius and Schneider, 2001). The Kappa coefficient was used to verify precision of the simulated results. Large Kappa coefficient means smaller difference of two images and higher simulated precision (Lu et al., 2015).
(2) Land use scenarios
Since Qihe catchment is not a compact administrative district, it is hard to predict its future land use required. For this paper, scenarios analysis was performed, according to features of each scenario and General Land Use Planning of Shanxi Province and General Land Use Planning of Henan Province, and the modified Markov model process transfer probability and CLUE-S model input parameters were used to estimate all each land use types of demand in 2025 under different scenarios. Detailed scenarios are:
1) Natural growth scenario (Q1). According to 2015 land use data and 2005-2015 matrix of land use transformation probability, taking 10 years as the step size, we predicted areas of all land use types in 2025 within the study area under natural growth scenario.
2) Cultivated land protection scenario (Q2). This scenario aims to strengthen the protection of cultivated land through curbing the expansion of construction land and slowing down the transformation probability of cultivated land into other land types. Under this scenario, the transformation probability of cultivated land into construction land decreased by 80%, and the transformation probability of cultivated land into woodland, grassland, and water body decreased by 30%, and the probability of cultivated land being transferred into unused land decreased by 100%.
3) Ecological conservation scenario (Q3). This scenario strengthens the protection for woodland, grassland and water body, but also strengthens the transformation of other land use types into ecological land. Under this scenario, the transformation probability of wooland, grassland and water body into construction land decreased by 90%, and the probability for transforming woodland, grassland and water body into unused land decreased by 100%, and the probability for cultivated land being transformed into woodland decreased by 20%, and the probability for transforming cultivated land into construction land decreased by 60%.
Based on the 2005-2015 land use transformation probability, combined with land use demand under different scenarios, we formulated ELAS value for all land use types in different scenarios (Table 1). In natural growth scenario (Q1), transformation probabilities of all land use types do not change and are the same as probabilities in 2005-2015. In cultivated land protection scenario (Q2), because the transformation limit for cultivated land is strengthened and unused land is required to be transformed into other types of the land, we increased ELAS value of cultivated land to 0.9 and decreased ELAS value of unused land to 0.5. In ecological conservation scenario (Q3), to effectively protect ecological land, increase transforming limit for woodland, grassland and water body, also require unused land to be transferred into other land types, ELAS value of woodland, grassland and water body increased by 0.1, while the ELAS value of unused land decreased by 0.1.
Type
Cultivated land
Woodland
Grassland
Water body
Construction land
Unused land
Q1
0.7
0.7
0.7
0.8
0.9
0.6
Q2
0.9
0.7
0.7
0.8
0.9
0.5
Q3
0.7
0.8
0.8
0.9
0.9
0.5
Table 1.
The ELAS of all land use types under different scenarios
2.4 Ecosystem carbon storage evaluation based on InVEST model
(1) Estimation of carbon storage. Usually, the estimation of ecosystem carbon storage by InVEST model includes four basic carbon sinks (aboveground, underground, soil and dead organic matter). However, due to the difficulty of obtaining carbon sink data for dead organic matter, for this study, only the other three carbon sinks were considered. The principle of calculating carbon storage is:
where i is a certain land use type; Ci-above is the aboveground carbon density of land use type i (t/ha); Ci-below is the underground biomass carbon density of land use type i (t/ha); Ci-soil is the soil carbon density of land use type i (t/ha); Ctot is the total carbon storage in the ecosystem (t); Si is the area of land use type i (ha); n is the number of land use types, which equals to 6 in this study.
(2) Determination of carbon density data. At first, combining the results of related studies (Li et al., 2003) with the root to shoot ratios of different land use types (Fang et al., 1996; Piao et al., 2004; Huang et al., 2006), we obtained national levels of aboveground biomass, underground biomass and soil carbon density data for cultivated land, woodland and grassland; according to a study, we acquired the aboveground biomass and soil carbon density for water body, construction land and unused land of Jiangsu Province (Chuai et al., 2007), and underground carbon density was 0. Then, we obtained mean annual temperature and precipitation data of the whole nation, Jiangsu Province and Qihe catchment through researches, these values are 9℃, 15.7℃, 11.9℃ and 628 mm, 1040.4 mm, 573.7 mm, respectively. Finally, we revised data using relationship model for biomass carbon density, soil carbon density, temperature and precipitation from studies by Chen et al. (2007), Giardina and Ryan (2000) and Alam et al. (2013) and obtained carbon density data in the study area (Table 2).
Type
Ci-above
Ci-below
Ci-soil
Cultivated land
4.02
0.76
105.14
Woodland
55.74
12.14
174.97
Grassland
0.39
2.46
96.89
Water body
0.04
0
64.03
Construction land
0.01
0
57.63
Unused land
0.01
0
58.89
Table 2.
Carbon density of different land use types in the Qihe catchment, China (t/ha)
Based on land use and carbon density data in carbon module of InVEST model, we calculated the carbon storage in 2005, 2015 and 2025 in Qihe catchment and conducted an in-depth analysis of the spatio-temporal changes.
3 Results analysis
3.1 Land use simulation test and change features
(1) Diagnose of land use change driving factors. The logistic regression model was used to conduct regression analysis on 2005 land use data and driving factors (Table 3). Except for grassland, ROC values for the land use types were all above 0.8, which means that selected driving factors have good explanation capacity for land use spatial pattern. Grassland had the lowest ROC value, which is 0.711, mainly due to scattered distribution of grassland, and thus had low correlation between its spatial distribution and driving factors.
Encode
Cultivated land
Woodland
Grassland
Water body
Construction land
Unused land
Beta coefficient
Exp(B)
Beta coefficient
Exp(B)
Beta coefficient
Exp(B)
Beta coefficient
Exp(B)
Beta coefficient
Exp(B)
Beta coefficient
Exp(B)
Constant
2.1439
8.5329
-4.8852
0.0076
-1.9361
0.1443
-3.7741
0.0230
0.2381
1.2688
-13.1827
0
sc1gr0
0.0007
1.0007
0.0014
1.0014
-0.0014
0.9986
-0.0023
0.9977
-
-
0.0017
1.0017
sc1gr1
-0.1333
0.8752
0.0980
1.1029
0.0388
1.0395
-0.0896
0.9143
-0.0113
0.9888
0.0738
1.0766
sc1gr2
0.0004
1.0004
-0.0002
0.9998
-
-
-
-
-
-
-
-
sc1gr3
-0.0150
0.985
0.0105
1.0106
-0.0211
0.9791
0.1532
1.1656
-
-
-
-
sc1gr4
0.0084
1.0085
0.0638
1.0659
-0.0825
0.9209
-0.2295
0.7949
0.1963
1.2169
-
-
sc1gr5
-0.0325
0.9680
0.1033
1.1088
-
-
-
-
-
-
-
-
sc1gr6
-
-
0.0001
1.0001
-
-
-
-
-
-
-
-
sc1gr7
-0.0005
0.9995
0.0002
1.0002
0.0004
1.0004
0.0002
1.0002
-0.0090
0.9911
-
-
sc1gr8
-
-
-
-
0.0001
1.0001
-
-
-
-
-
-
sc1gr9
0.0001
1.0001
-
-
-
-
0.0001
1.0001
-
-
-
-
ROC value
0.810
0.848
0.711
0.843
0.956
0.825
Table 3.
Results of logistic regression for different land use types in 2005 in the Qihe catchment, China
The distribution probability of cultivated land is mainly related to topography, soil type and the distance to rural residential settlements and major roads. Specifically, it is highly related to slope, namely, when slope increases by 1º, the distribution probability of cultivated land will decrease by 12.48%. The distribution probability of woodland has significant positive correlation with total nitrogen concentration in soil; when total nitrogen concentration increases by 1 g/kg, the distribution probability of woodland will increase by 10.88%. The factor for woodland distribution is slope; when slope increases by 1º, the distribution probability of woodland will increase by 10.29%. The distribution probability of grassland has significant negative correlation with soil organic matter concentration; when organic matter concentration increases by 1 g/kg, the distribution probability of grassland will decrease by 7.91%. The next most influential factor for grassland is slope; when slope increases by 1º, the distribution probability of grassland will increase by 3.95%. Compared with the above land use types, there are fewer factors that can explain the distribution of water body, construction land and unused land, moreover, the correlation between land use types and driving factors is not significant. The distribution probability of water body is mainly related to soil type and organic matter concentrations; the distribution probability of construction land has positive correlation with organic matter and negative correlation with slope; the distribution probability of unused land is significantly correlated with both altitude and slope.
(2) The features of land use change of Qihe catchment in 2005-2015. Table 4 is the land use transfer matrix of Qihe catchment in 2005-2015. According to Table 4, 2015 land use types were mainly cultivated land, grassland and woodland, their areas occupied 27.08%, 29.88% and 35.19% of the study area, respectively, followed by construction land and water body (5.41% and 2.43%), and unused land occupied the smallest area, only 0.02%. In general, cultivated land and woodland areas showed a decreasing trend in 2005-2015, a reduction of 16.99% and 2.57%, respectively. Water body and construction land were significantly expanded, their areas increased by 50.27% and 37.8%, respectively. Area that changed in the ten years was 62,286.75 ha, 28.2% of the total area. Cultivated land area converted into other land types (25,236 ha) accounted for about twice as much as the areas that was transferred-in (12,890.25 ha), and therefore became the main contributor to other types of the land. Woodland transferred-out area (16,427.25 ha) was larger than the transferred-in area (14,670 ha), which was mainly changed into grassland (12,136.5 ha), and the transferred-in lands were mainly grassland (8196.75 ha) and cultivated land (6169.5 ha). Grassland transferred-out area (16,177.5 ha) was smaller than the transferred-in area (25,143.75 ha), and the transferred-in land was mainly woodland (12,136.5 ha) and cultivated land (12,144 ha). Water body transferred-out area (2198.25 ha) was smaller than the transferred-in area (4009.5 ha), and 61.56% of the transferred-in area was converted from cultivated land. Construction land was significantly expanded in the ten years, namely, transferred-in area (5541.75 ha) was about 2.5 times of the transferred-out area (2238.75 ha), and 80.76% of the transferred-in area came from cultivated land.
2015
2005
Cultivated land
Woodland
Grassland
Water body
Construction land
Unused land
Total
Transferred-in Total
Cultivated land
47422
3262.5
6655.5
1257.75
1714.5
0
60312.25
12890.25
Woodland
6169.5
51878.75
8196.75
231.75
67.5
4.5
66548.75
14670
Grassland
12114
12136.5
53237.5
591.75
299.25
2.25
78381.25
25143.75
Water body
2468.25
623.25
762.75
1404.75
155.25
0
5414.25
4009.5
Construction land
4475.25
391.5
555.75
117
6499.25
2.25
12041
5541.75
Unused land
9
13.5
6.75
0
2.25
2
33.5
31.5
Total
72658
68306
69415
3603
8738
11
222731
-
Transferred-out Total
25236
16427.25
16177.5
2198.25
2238.75
9
-
62286.75
Table 4.
Land use transfer matrix for 2005-2015 (ha) in the Qihe catchment, China
(3) Simulation results test. For the simulated 2015 land use distribution based on land use data of 2005, a precision test based on Kappa coefficient was conducted. Figure 2 shows 2005 land use, 2015 current status and simulated land use result. Correct simulated raster grid number is 82,768, and the correct rate is 83.8%, Kappa coefficient is 80.6%, which meet our research requirements.
Figure 2.
Land use map of 2005 (a) and 2015 (b) as well as simulated map of 2015 (c) in the Qihe catchment, China
Figure 3 shows the results of land use simulation of Qihe catchment in 2025 under different scenarios, and Figure 4 shows land use changes of 2015-2025 under different scenarios. According to these two figures, cultivated land area shows a decreasing trend under natural growth and ecological conservation scenarios, with decreases of 6081.75 ha (10.03%) and 3280.5 ha (5.41%), respectively; the decrease will be effectively controlled under cultivated land protection scenario, and cultivated land will increase by 3352.5 ha (5.53%). As a main ecological land use type, woodland will be effectively protected under ecological conservation scenario, and its area will reach 68,724 ha (30.84%), whereas it will gradually decrease in the other two scenarios. Grassland area shows a significant increase in natural growth scenario, with an increase of 4925.25 ha (6.28%). There is a small increase of 486 ha (0.62%) under the ecological conservation scenario. However, due to the control of conversion from cultivated land to grassland under cultivated land protection scenario, grassland area will be reduced. The changes of water body area under the three scenarios are similar to those of grassland area, which will increase under natural growth and ecological conservation scenarios, but decrease under cultivated land protection scenario. Construction land will increase under all the three scenarios, and expands in a “ring-layer” mode with residential settlements as centers, and expands in an “axis” mode along the two sides of rivers and roads. Since both cultivated land protection and ecological conservation scenarios can strengthen the protection of cultivated land and ecologically used land, the expansion of construction land will be effectively limited, it only increases by 13.5 ha (0.11%) and 297 ha (2.44%), respectively, under these two scenarios. Unused land area will increase by 13.5 ha in natural growth scenario, but this area will be developed and utilized under cultivated land protection and ecological conservation scenarios, and thus will decrease by 20.25 ha and 29.25 ha, respectively in these two scenarios.
Figure 3.
The simulated results of land use in 2025 under different scenarios in the Qihe catchment, China
3.3 Spatio-temporal change of carbon storage and density in ecosystem
According to Figure 5a, the total carbon storage values of Qihe catchment in 2005 and 2015 were 3.23×10⁷ t and 3.16×10⁷ t, respectively. Average carbon density was 144.79 t/ha and 141.9 t/ha. These values therefore decreased by 0.07×10⁷ t and 2.89 t/ha in the 10 years, respectively. The main reasons for the decrease of carbon storage and density are the expansion of construction land and conversions among woodland, cultivated land and grassland. For 2015-2025, carbon storage and density continue decreasing under natural growth scenario, with decreases of 0.03×10⁷ t and 1.38 t/ha, respectively; the decrease rate is lower under cultivated land protection scenario, with decreases of 0.01×10⁷ t and 0.44 t/ha; carbon storage and density will significantly increase under ecological conservation scenario, with increases of 3.19×10⁷ t and 143.26 t/ha, respectively. In conclusion, carbon storage will significantly decrease under natural growth scenario, cultivated land protection scenario can slow down carbon storage decrease, and ecological conservation scenario can effectively increase ecosystem carbon storage.
Figure 5.
Carbon storage, carbon density and the change of carbon density along with the increase of altitude in 2005, 2015 and different scenarios of 2025 in the Qihe catchment, China
Figure 5b shows the change of carbon density along with the change of altitude, and Figure 6 shows spatial distribution of carbon density. According to Figure 5b, with the increase of altitude, carbon density of Qihe catchment changes in an “N-shaped” trend. It increases first, then decreases and increases again. High carbon density (≥150 t/ha) region is mainly distributed in areas where the altitude is higher than 650 m, which takes up 48% of the study area. Seen from Figure 6 (a, b, d, e and f), high carbon density regions are mainly located in Lingchuan and Huguan counties of Shanxi Province, a small part is located in the junction area between Linzhou and Hebi, Henan Province, which has large proportion of woodland; low carbon density regions are located in midstream Linzhou, downstream Hebi, Qixian and Xunxian counties, Henan Province. Compared with other regions, this study area has larger proportions of construction land and water body, thus has lower carbon density.
In addition, carbon density decreased mostly in the areas with altitudes lower than 600 m or between 1300 m and 1500 m in 2005-2015; carbon density mostly increased in the areas with altitudes of 1000-1100 m and 1700-1800 m. Under natural growth scenario, carbon density in low altitude area continued decreasing; under cultivated land conservation scenario, carbon density in low altitude area increased slightly; under ecological conservation scenario, the increase of carbon density mainly occurred in the area with an altitude higher than 1100 m.
Figure 6.
Spatial distribution of carbon density and carbon density changes in 2005, 2015 and different scenarios of 2025 in the Qihe catchment, China
According to Figure 6 (c, g, h and i) and Table 5, carbon density changes slightly, over 96% of the areas do not have changes. In 2005-2015, areas with significant decrease of carbon density comprise 3.45% and are scattered in distribution. Carbon density decrease mainly occurred in the middle and lower reaches of Qihe within the boundaries of Linzhou and Hebi because of the expansion of construction land, which has occupied cultivated land. Carbon density decrease in Qihe upstream is because the woodland was transferred into grassland and grassland was transferred into water body areas; areas with significant increase of carbon density take up 0.43% of the total area and are concentrated in the junction area between Linzhou and Huguan, as well as the area between Huixian and Lingchuan, which is related with ‘Grain for Green’ Program and ‘Ecological Rehabilitation Project’ in this region. In 2015-2025, both area with significant decrease of carbon density and area with significant increase of carbon density under natural growth scenario will have lower proportions, with decreases of 1.61% and 0.12%, respectively. Two types of areas are cross distributed in upstream region and decreased carbon density is dominant in low stream region; under cultivated land protection scenario, the proportion of area with significant decrease of carbon density will significantly decrease (0.6%), the proportion of area with significant increase of carbon density will be a little bit higher (0.51%), and the two types of areas are cross distributed in the upper and middle stream region, whereas the increased area is dominant in downstream region due to the effective control of construction land expansion in low altitude area; under ecological conservation scenario, the proportion of area with significant decrease of carbon density will be significantly lower (0.17%), with a scattered distribution in the middle and downstream region. The proportion of area with significant increase of carbon density will be higher (1.1%), this region is mainly concentrated in middle and upper stream areas where ecological restoration mainly occurs, the conversion of cultivated land and grassland into woodland will increase carbon density of this area.
Time period
Significantly decreased(≤-20 t/ha)
Basically unchanged(-20 to 20 t/ha)
Significantly increased (≥20 t/ha)
Raster grid
Proportion (%)
Raster grid
Proportion (%)
Raster grid
Proportion (%)
2005-2015
3419
3.45
95205
96.11
430
0.43
2015-2025 (Q1)
1599
1.61
97340
98.27
115
0.12
2015-2025 (Q2)
595
0.60
97958
98.89
501
0.51
2015-2025 (Q3)
170
0.17
97795
98.73
1089
1.10
Table 5.
Statistics on carbon density changes during 2005-2015 and 2015-2025 under different scenarios in the Qihe catchment, China
(1) Cultivated land and woodland areas in Qihe catchment in 2005-2015 declined by 16.99% and 2.57%, respectively. Water body area and construction land greatly expanded, with increases of 50.27% and 37.8%, respectively. In 2015-2025, under natural growth scenario, cultivated land will continue decreasing and construction land will continue expanding; under cultivated land protection scenario, cultivated land will increase by 5.53%, whereas construction land will only increase by 0.11%; under ecological conservation scenario, cultivated land will decrease by 5.41%, and ecological land all shows trend of increasing to different degrees.
(2) Carbon storage and density in 2015 were 3.16×10⁷ t and 141.9 t/ha, respectively, which represent decreases of 0.07×10⁷ t and 2.89 t/ha over the preceding 10 years. In 2005-2015, carbon density mainly decreased in low altitude area, areas with increased carbon density were equal to areas with decreased carbon density in high altitude areas. The large expansion of construction land in the middle and lower reaches of Qihe and the woodland degradation in the upper reach are the main reasons for carbon density decrease.
(3) In 2015-2025, under natural growth scenario, carbon storage and density will also significantly decrease by 0.03×10⁷ t and 1.38 t/ha, respectively. Areas with decreased carbon are far more prevalent than areas with increased carbon, which is attributed to the decrease of carbon sequestration ability in low altitude region; under cultivated land protection scenario, the reduction of carbon storage and carbon density is slowed down (0.01×10⁷ t and 0.44 t/ha), which is due to the strengthening of carbon sequestration ability in low altitude region; under ecological conservation scenario, areas with increased carbon are more prevalent than areas with decreased carbon, both carbon storage and density will significantly increase and can reach 3.19×10⁷ t and 143.26 t/ha, respectively, mostly occur in the area where the altitude is higher than 1100 m.
In conclusion, carbon sequestration ability in Qihe catchment shows a decreasing trend in 2005-2015. This decrease continues in natural growth scenario, whereas the cultivated land protection scenario can effectively control the decrease, and the ecological conservation scenario can strengthen carbon sequestration ability but cannot effectively control the area decrease of cultivated land. Therefore, for land use structure optimization of Qihe catchment in the future, it will be helpful to consider both cultivated land protection and ecological conservation scenario, properly control the expansion of construction land in low altitude areas, strengthen the protection for high quality cultivated land, conduct ecological restoration project in high altitude areas, and concede low quality cultivated land on steep hill to forest. At the same time, increasing carbon storage, food safety and cultivated land quality will be ensured.
4.2 Discussion
(1) Carbon density data in this study were obtained through searches and model modifications, compared with previous regional studies that directly used carbon density value at national level, method used in this paper is a novel effort and will be beneficial for improving accuracy of regional ecosystem carbon storage estimations. Due to the limitation of data availability, we collected several kinds of measured or model simulated carbon density data around study area and compared them with the results in this study. Wang (2007) found that aboveground biomass carbon density of cultivated land and woodland in Taihang Mountains were 4.53 t/ha and 50.92 t/ha, respectively, which are close to our modified aboveground biomass carbon density of cultivated land and woodland (4.02 t/ha and 55.74 t/ha). Piao et al. (2004) found that aboveground and underground biomass carbon densities of grassland in Henan Province are 0.63 t/ha and 2.82 t/ha, which are higher than those of grassland aboveground and underground biomass carbon density in this study (0.39 t/ha and 2.46 t/ha), the latter one is closer to our result; Li (2016) found that soil carbon density of construction land and unused land in Henan Province are 60 t/ha and 53.3 t/ha, which are in accordance with the soil carbon density of construction land and unused land in this study (57.63 t/ha and 58.89 t/ha); Chen (2003) found that soil carbon density of woodland in North China region is 187.51 t/ha, which is similar to the result in this study (174.97 t/ha). In general, carbon density data obtained through model parameter modification in this study is reliable and reasonable, and thus illustrates that this method is a fast and an effective way to obtain regional ecosystem carbon density information.
(2) The application of Markov-CLUE-S composite model has overcome the disadvantage of single model, displayed the advantages on quantity prediction and spatial allocation of two models, achieved double optimizations quantitatively and spatially for land use change simulations, and improved the accuracy of the prediction for future land use patterns. In the meantime, there are also some shortages. At first, when setting future land use scenarios, it only estimated required areas of all land use types for different scenarios through revising Markov model transfer probabilities but did not consider related local policies. However, with the social and economic development, future land use changes will be influenced by local policies more and more. Thus, how to set more reasonable land use demand combined with policy will be a focus for future research on land use change simulations. Second, selection of driving factors has considerable influence on simulation precision. The driving factors selected in this study are all easy to be spatialized, such as topography, soil feature and distance. However, regional land use changes are usually affected by socio-economy and policy. Therefore, selected driving factors are not comprehensive and have weakened the explaining effects of regression functions to some degree. In the future, how to quantitatively and spatially express socio-economic factors and related policies, and bring them into driving factors system, will be crucial to improve simulation precision of CLUE-S model.
(3) There are some uncertainties regarding the estimated carbon storage. At first, input data for InVEST model is uncertain. When the Markov-CLUE-S composite model is used to simulate land use patterns in different scenarios, due to less consideration of effects by socio-economy and related local policies, simulated results have some uncertainties. In addition, although the modified carbon density value drawn from previous researches and meteorological data is close to carbon density data around the study area, carbon density value may undergo dynamic changes under human activities and environmental changes, thus the modified carbon density value can be uncertain for carbon storage estimation. Second, the uncertainty of estimated results comes from the model itself. Carbon storage module of InVEST model is more focused on carbon density difference among various land use types but ignores carbon sequestration difference associated with land use types and vegetation age organizations, which brought some obstacles to carbon storage service spatial pattern simulations and make the estimation uncertain. In future research, measured data through field survey should be obtained to verify the reasonability of carbon density value, or enough field monitoring data should be collected to reveal effects on carbon density under inner space heterogeneity of land use types and vegetation age structures, to improve the accuracy for regional ecosystem carbon storage evaluation.
[10] Biomass and net production of forest vegetation in China. Acta Ecologica Sinica, 16, 497-508(1996).
[11] et alCarbon sequestration in China’s terrestrial ecosystems under climate change: Progress on ecosystem carbon sequestration from the CAS Strategic Priority Research Program. Bulletin of the Chinese Academy of Sciences, 30, 848-857(2015).
[19] Modeling study of vegetation shoot and root biomass in China. Acta Ecologica Sinica, 26, 4156-4163(2006).
[20] Prediction of carbon exchanges between China terrestrial ecosystem and atmosphere in 21st century. Science in China Series D: Earth Sciences, 38, 211-223(2008).
[38] A research on the vegetation in the southern part of Taihang Mountain. Journal of Shanxi Normal University (Natural Science Edition), 7, 54-58(1993).
[45] et alSpatial variations of terrain and their impacts on landscape patterns in the transition zone from mountains to plains: A case study of catchment in the Taihang Mountains. Scientia Sinica (Terrae), 48, 476-486(2018).
[46] et alSpatial distribution of forest vegetation carbon stock in China based on HASM. Acta Geographica Sinica, 24, 1212-1224(2013).
Wenbo ZHU, Jingjing ZHANG, Yaoping CUI, Lianqi ZHU. Ecosystem carbon storage under different scenarios of land use change in Qihe catchment, China[J]. Journal of Geographical Sciences, 2020, 30(9): 1507