
Shuwen Xue, Chuanjie Hu, Miao Zhang, Huanyang Chen, "Bioinspired lenses from cats’ eyes," Chin. Opt. Lett. 20, 012202 (2022)
- Chinese Optics Letters
- Vol. 20, Issue 1, 012202 (2022)
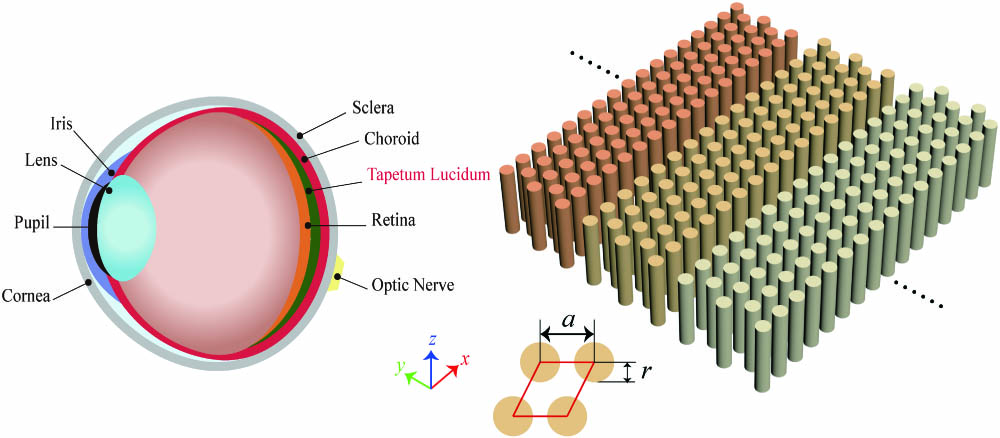
Fig. 1. Structures of a cat’s eye (left picture) and tapetum lucidum (right picture). The tapetum lucidum lies behind the retina constituted by some columnar photonic crystals arranged in regular hexagons with different radii r and spaces a.
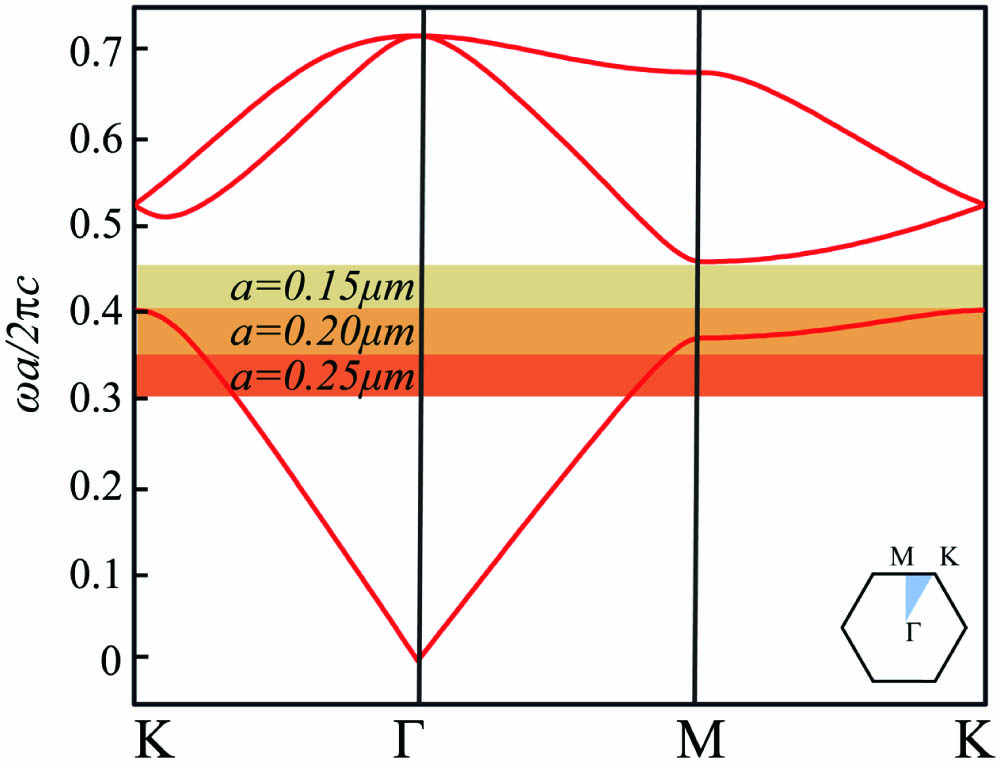
Fig. 2. Photonic band structures for transverse electric (TE) modes of a triangular array of medium columns (refractive index n = 1.8, r = 0.05 µm) in the air. The inset at the corner shows the high symmetry points of the irreducible Brillouin zone (shaded light blue one). Note that complete photonic bandgaps happen for different colors with a = 0.15 µm, a = 0.20 µm, and a = 0.25 µm.
Fig. 3. Electric field intensity |E|2 distributions of a Gaussian beam impinging on the Luneburg lens and the corresponding intensity comparison chart. (a)–(c) The electric field intensity of a Gaussian beam impinging on the Luneburg lens along y = 2 µm with different wavelengths. (d)–(f) The electric field intensity of a Gaussian beam impinging along the x axis, and the red line is along x = 3.5 µm. The detailed field distributions are inserted at the bottom of each figure, which are marked by the black dashed frames. (g)–(i) Intensity comparison with (red curves) and without (black curves) photonic crystals along the red line of (d)–(f).
Fig. 4. Intensity comparison from 333 nm to 517 nm at the point (3.5, 0) and the reflectance of photonic crystals. (a) The solid blue and orange lines denote the intensity with and without photonic crystals, respectively. The dashed orange line denotes the intensity with PEC. (b) The solid blue and orange lines denote the reflectance of one layer and two layers of photonic crystals, respectively.
Fig. 5. Electric field intensity |E|2 distributions of a plane wave and a Gaussian beam impinging on the Luneburg lens and the corresponding intensity comparison chart. (a)–(c) The electric field intensities of the plane wave impinging on the Luneburg lens. (d)–(f) The electric field intensities of a Gaussian beam impinging on the Luneburg lens at 25° with different wavelengths. (g)–(i) Intensity comparison with (red curves) and without (black curves) photonic crystals along the red lines of (d)–(f).


Set citation alerts for the article
Please enter your email address

© Copyright 2018-2021 | Chinese Laser Press. All Rights Reserved 沪ICP备15018463号-20