• Chinese Optics Letters
  • Vol. 14, Issue 5, 051603 (2016)
Shiyu Zhang, Quanjun Pan, Xu Fang, Kening Mao, and Hui Ye*
Author Affiliations
  • State Key Laboratory of Modern Optical Instrumentation, College of Optical Science and Engineering, Zhejiang University, Hangzhou 310027, China
  • show less
    DOI: 10.3788/COL201614.051603 Cite this Article Set citation alerts
    Shiyu Zhang, Quanjun Pan, Xu Fang, Kening Mao, Hui Ye. Fabrication and characteristics of silicon-rich oxide thin films with controllable compositions[J]. Chinese Optics Letters, 2016, 14(5): 051603 Copy Citation Text show less
    (a) O/Si atomic ratio x of #A samples obtained from the XPS measurements as a function of the OFR. (b) The ratio x of #B samples as a function of the argon flow rate. (c) The ratio x and (d) the deposition rate of #A and #B samples as a function of the oxygen content [O2/(Ar+O2) ratio].
    Fig. 1. (a) O/Si atomic ratio x of #A samples obtained from the XPS measurements as a function of the OFR. (b) The ratio x of #B samples as a function of the argon flow rate. (c) The ratio x and (d) the deposition rate of #A and #B samples as a function of the oxygen content [O2/(Ar+O2) ratio].
    (a) Transmittance and (b) the refractive indices of SiOx films (#A samples) with various O/Si atomic ratios x values. (c) The refractive index and the extinction coefficient of SiOx films (#A samples) as a function of ratio x at 550 nm wavelength.
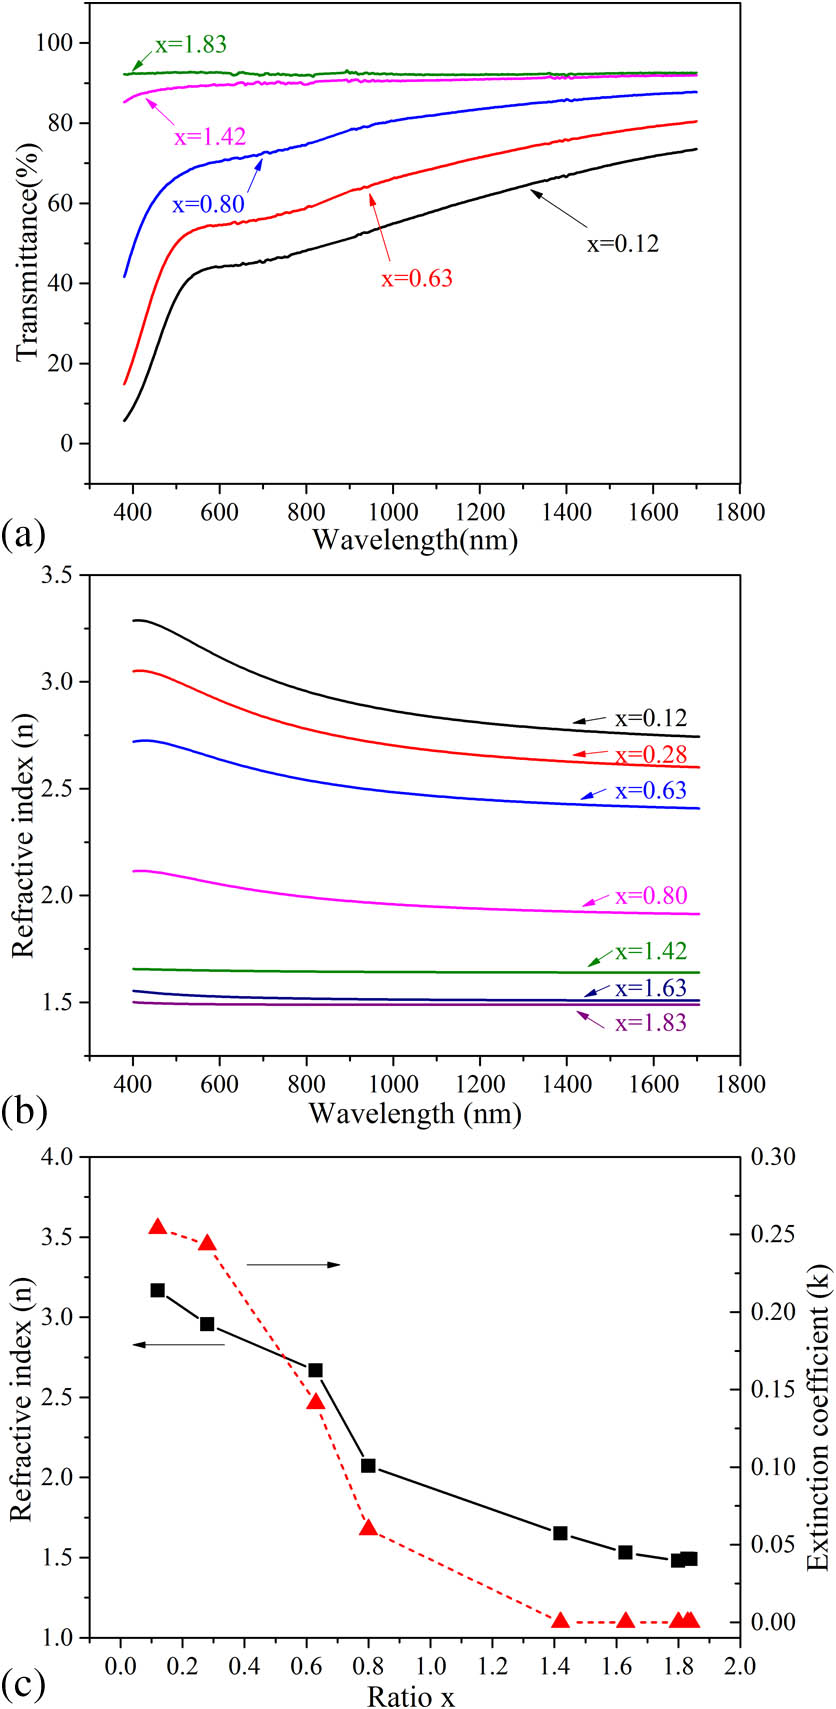
    Fig. 2. (a) Transmittance and (b) the refractive indices of SiOx films (#A samples) with various O/Si atomic ratios x values. (c) The refractive index and the extinction coefficient of SiOx films (#A samples) as a function of ratio x at 550 nm wavelength.
    XPS spectra of sample #A1, #A3, #A4, #A5, and #A9, corresponding to the O/Si atomic ratios x of 0.12, 0.63, 0.80, 1.42, and 1.84, respectively. On the left side, the red hollow circles represent the experimental data and the black solid lines are the fitted components (Si0, Si1+, Si2+, Si3+, and Si4+ peaks) of the Si 2p core level and the sum line of the peaks. On the right side, the red dots represent the relative intensities of the components in the Si 2p core level and the black squares are the components calculated according to the RBM model.
    Fig. 3. XPS spectra of sample #A1, #A3, #A4, #A5, and #A9, corresponding to the O/Si atomic ratios x of 0.12, 0.63, 0.80, 1.42, and 1.84, respectively. On the left side, the red hollow circles represent the experimental data and the black solid lines are the fitted components (Si0, Si1+, Si2+, Si3+, and Si4+ peaks) of the Si 2p core level and the sum line of the peaks. On the right side, the red dots represent the relative intensities of the components in the Si 2p core level and the black squares are the components calculated according to the RBM model.
    Parameter#A samples#B samples
    O2 flow rate (sccm)0, 0.5, 1.0, 1.5, 2.0, 2.5, 3.0, 3.5, 4.01.0
    Ar flow rate (sccm)2010, 20, 40, 100
    Work pressure (Pa)0.10.1
    RF power (W)500500
    Table 1. Sets of Sputtering Parameters
    LabelOxygen content (%)OFR (sccm)Ratio x
    #A22.440.50.28
    #B22.441.00.39
    #A59.092.01.42
    #B49.091.01.30
    Table 2. Parameters of Deposited Samples
    Shiyu Zhang, Quanjun Pan, Xu Fang, Kening Mao, Hui Ye. Fabrication and characteristics of silicon-rich oxide thin films with controllable compositions[J]. Chinese Optics Letters, 2016, 14(5): 051603
    Download Citation