
Zhihui Jiang, Shen Zhang, Congxi Song, Hongmin Mao, Xin Zhao, Huanjun Lu, Zhaoliang Cao, "Improvement of Raman spectrum uniformity of SERS substrate based on flat electrode," Chin. Opt. Lett. 21, 113001 (2023)
- Chinese Optics Letters
- Vol. 21, Issue 11, 113001 (2023)
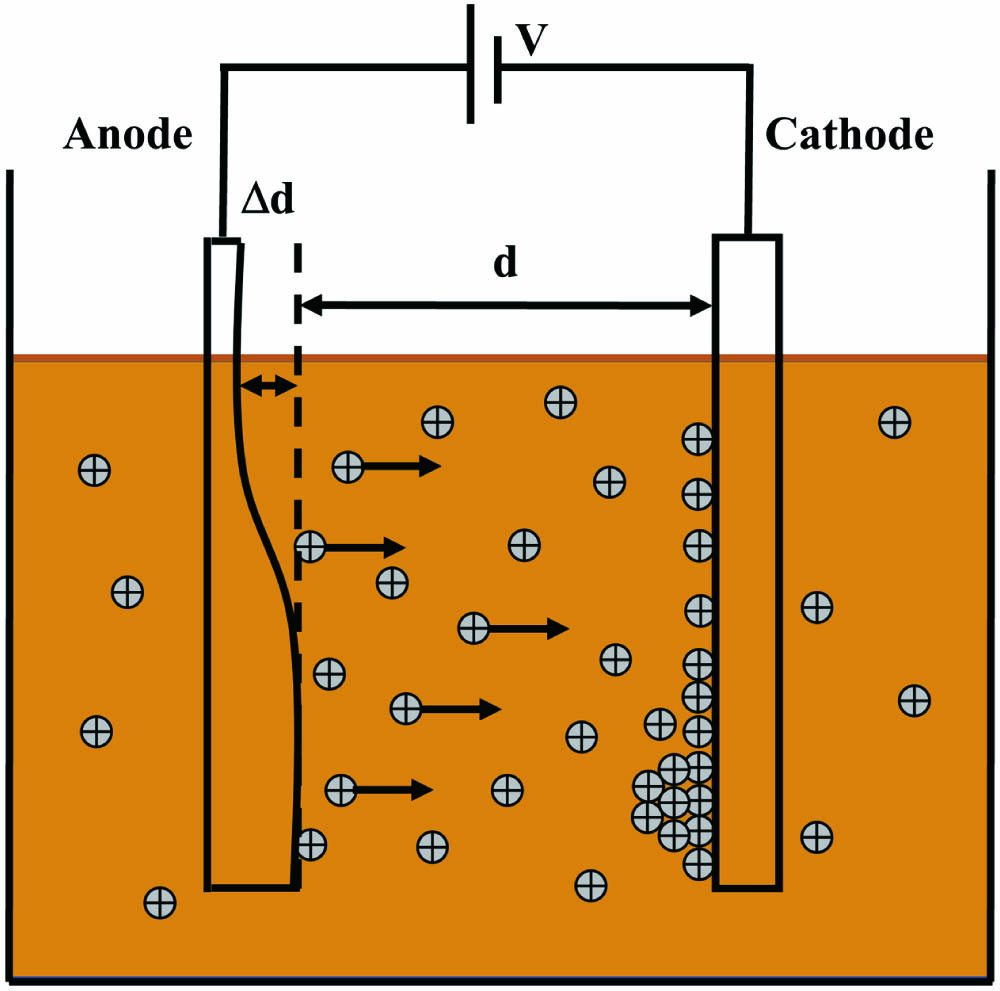
Fig. 1. Schematic diagram showing the electrodeposition process.
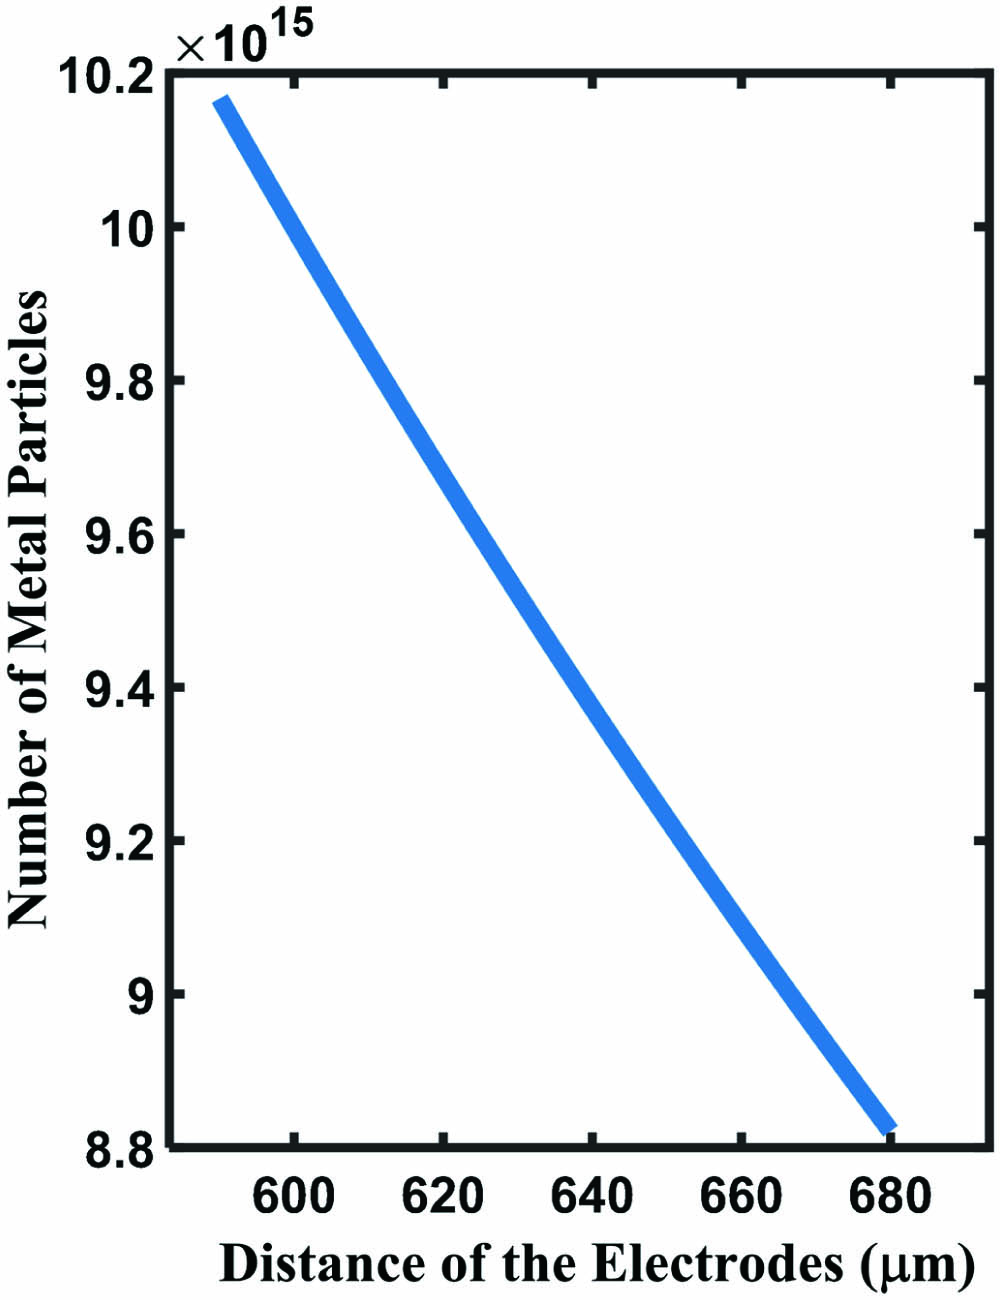
Fig. 2. Relationship between the number of deposited particles and the distance of the electrodes.
Fig. 3. Selected scan position and area of (a) the silver plate and (b) the ITO glass by the probe-type surface contouring instrument.
Fig. 4. Profiles of the electrode surfaces: (a) silver plate; (b) ITO glass.
Fig. 5. Schematic representation of the electrochemical deposition of the SERS substrate: (a) phase states of lyotropic LC; (b) synergistic growth process of silver nanoflowers in electrodeposition.
Fig. 6. SEM characterization of the SERS substrate prepared with the silver plate as an anode: (a) the five chosen positions on the fabricated SERS substrate; (b)–(f) surface morphologies at Positions 1–5; (g) zoom-in image of the formed silver nanoflower.
Fig. 7. (a)–(e) Surface morphologies at Positions 1–5 of the SERS substrate prepared with the ITO glass as an anode.
Fig. 8. SEM images used for surface coverage calculation: (a) gray-scale image; (b) binarized image.
Fig. 9. Comparison of surface coverage of SERS substrates fabricated from the silver plate and ITO glass anodes.
Fig. 10. Schematic diagram of the distance of electrodes with the silver plate (left) and the ITO glass (right) as the anode.
Fig. 11. Comparison of the simulation and experimental surface distribution uniformity of the SERS substrate fabricated from (a) a silver plate anode and (b) an ITO glass anode.
Fig. 12. Raman spectrum detected at different positions of the substrate fabricated from (a) a silver plate anode and (b) an ITO glass anode; (c) comparison of their peak intensities at 613 cm-1; (d) Raman spectroscopy detection of R6G on a silicon wafer.
|
Table 1. Parameters Used in the Simulation


Set citation alerts for the article
Please enter your email address

© Copyright 2018-2021 | Chinese Laser Press. All Rights Reserved 沪ICP备15018463号-20