
Zhihui Jiang, Shen Zhang, Congxi Song, Hongmin Mao, Xin Zhao, Huanjun Lu, Zhaoliang Cao. Improvement of Raman spectrum uniformity of SERS substrate based on flat electrode[J]. Chinese Optics Letters, 2023, 21(11): 113001
- Chinese Optics Letters
- Vol. 21, Issue 11, 113001 (2023)
Abstract
1. Introduction
Raman spectroscopy is widely used in various biochemical fields such as food safety, pharmaceutical manufacturing, and environmental protection, due to its capabilities in molecular structure identification and biological detection[1-5]. To improve the analysis sensitivity, the surface enhancement Raman scattering (SERS) technique was discovered and developed[6-9], which realized the trace or even single molecule detection of the material[10,11]. The prominent performance of SERS mainly benefits from the significant electromagnetic focusing field enhancements brought by “hot spots” generated from the nanostructures on the SERS substrates[12-17]. In the past decades, enormous attentions have been focused on the fabrication of low cost, uniform, reproducible, and efficient SERS substrates[18-23].
SERS signal inhomogeneity is a significant and long-lasting issue, resulting from inconsistent electromagnetic field distribution caused by nonuniform SERS substrates[24-29]. This restricts the actual applications of the SERS substrate for the quantitative detection and analysis of the material. Currently, the reproducibility and homogeneity of SERS substrates are normally accomplished by advanced lithographic techniques[30-32], producing highly regular and periodic surface nanostructures, including gaps, tips, holes, ridges, triangular nanoprisms and nanocones, and so on[33-39]. However, the substrate is expensive, and the fabrication process is complicated, which would not be acceptable in commercial applications.
To solve this problem, in 2017, a lyotropic liquid crystal (LC) soft template method was proposed by our group, and a well-distributed flower-like silver nanostructures substrate was successfully prepared with high sensitivity[40,41]. In 2019, Li et al. fabricated low-cost and recyclable 3D shell-core nanostructures through a chemical reduction reaction[42]. These low-cost and simple preparation methods further promote the commercial applications of the SERS substrate. However, compared with the substrate fabricated with lithography, the spectrum uniformity of the SERS substrate is weaker while it is prepared with these low-cost methods. For improving the spectrum uniformity of the SERS substrate, our work group proposed a surface coverage method, in which the relation between the duty cycle of the nanostructure and the spectrum intensity was obtained and the spectrum uniformity was improved with the data processed[43,44]. However, as this method is complicated and it depends on the computation, it is unsuitable for actual applications of the SERS substrate.
Sign up for Chinese Optics Letters TOC. Get the latest issue of Chinese Optics Letters delivered right to you!Sign up now
In this work, based on the lyotropic LC soft template method, a direct and simple method was proposed to improve the spectrum uniformity of the SERS substrate. Concretely, the flat electrode method was demonstrated, and the effect of the electrode surface flatness was systematically investigated. Further, two types of electrodes, silver plate and indium tin oxide (ITO) glass, were chosen and compared. Consequently, the spectrum uniformity of the SERS substrate was improved greatly with the flat electrode. The results show that the SERS substrate is feasible for use as a commercial product for trace detection of the material.
2. Simulation
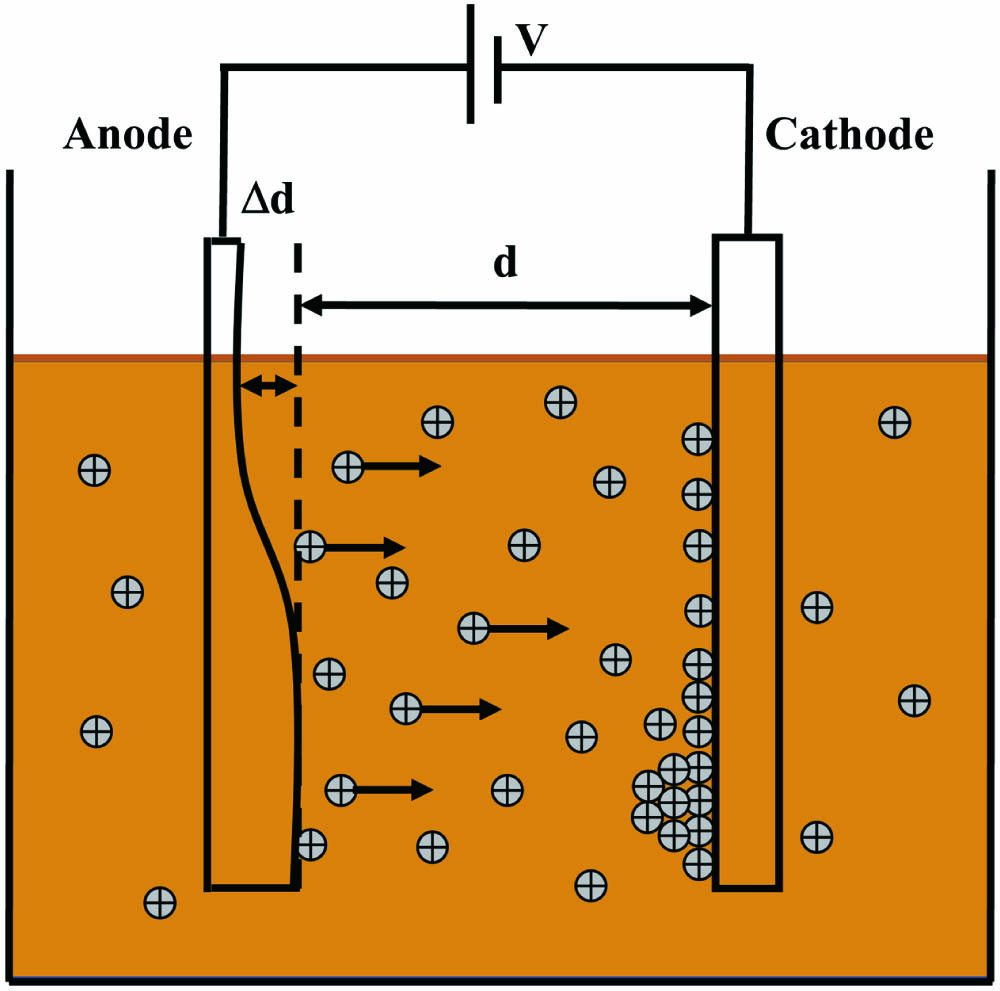
The SERS substrate is prepared by using a lyotropic LC soft template with the traditional electrochemical deposition method, as shown in Fig. 1. At first, an LC cell is fabricated with two electrode plates. Then, it is placed into the lyotropic LC, and the voltage is applied to prepare the SERS substrate. The electrode surface is normally rough and uneven, rather than ideally smooth. When the metal ions are electrodeposited, the unflatness of the electrodes will make the anode and cathode have different distances at different positions, which may also result in varied electrical force and deposition speed, and ultimately affect the number of metal particles deposited on the cathode surface. In this case, even under the same reaction condition, the number of metal particles deposited on the electrode surface may change with position as well. Hence, the flatness of the two electrode plates will affect the distribution of silver nanoparticles and the Raman spectrum uniformity of the SERS substrate. The simulation was performed according to the following equation:
| Parameter | Definition | Value |
|---|---|---|
| q | Charge amount of the silver ion | 1.6 × 10⁻¹⁹ C |
| U | Electrodeposition voltage | 5 V |
| m | Mass of the silver ion | 2.8 × 10⁻²² g |
| t | Electrochemical reaction time | 10,800 s |
| N1 | Number of silver ions per unit volume | 3.6 × 10⁷ |
Table 1. Parameters Used in the Simulation
![]()
Figure 1.Schematic diagram showing the electrodeposition process.
By changing the range of distance between the two electrodes, the relationship between the number of deposited particles and the electrode distance was simulated, as shown in Fig. 2.
![]()
Figure 2.Relationship between the number of deposited particles and the distance of the electrodes.
It can be illustrated that the deposited particle number reduced with the increasing distance. For example, when the distance between the two electrodes changes 50 µm, the number of metal particles will vary 7.7%. It speculated that the surface flatness of the electrode plate can significantly affect the growth uniformity and spectrum consistency of the SERS substrate.
3. Experiment
3.1. Measurement of the surface flatness of the electrodes
Normally, the silver plate and ITO glass are used as the anode and cathode, respectively, to prepare the SERS substrate[40,41,43,44]. However, the silver plate is rough. So, an ITO glass is utilized to replace the silver plate as the anode. To do the comparison, the SERS substrates are fabricated, respectively, with the anodes of silver plate and ITO glass. First, the surface flatness of the silver plate and the ITO glass was scanned separately by a probe-type surface contouring instrument (DektakXT, Bruker). The selected scanning position is shown in Fig. 3. The green arrows indicate the scan direction.
![]()
Figure 3.Selected scan position and area of (a) the silver plate and (b) the ITO glass by the probe-type surface contouring instrument.
The scan area was chosen as (the red rectangle in Fig. 3). The scan range was set to 1 mm, and the scan time was 50 s. The measurement can obtain the surface distribution of the silver plate and the ITO glass, as well as the difference between the surface peak and valley value (PV value), which gives a quantitative comparison of the surface flatness of the two plates. According to the probe contouring measurement, the profiles showing the surface fluctuation of the two electrodes were constructed, as shown in Fig. 4.
![]()
Figure 4.Profiles of the electrode surfaces: (a) silver plate; (b) ITO glass.
It is apparent from the profiles that the surface of the silver plate is full of dents, while that of the ITO glass is almost smooth and only slightly bumpy in the center. Quantitatively, the PV values are 73.6 µm for the silver plate and 4.7 µm for the ITO glass. Moreover, considering that ITO glass is consumable, two more samples were tested in order to avoid the contingency, which give similar PV values of 4.6 µm and 5.2 µm. The distinct contrast of the degree of the surface fluctuation between the silver plate and the ITO glass could provide a possible reason for the remarkable difference in surface homogeneity of the SERS substrate they produced.
3.2. Preparation and characterization of the SERS substrate
When preparing the SERS substrate with flower-like silver nanostructures, lyotropic LC was used as a soft template. The growth of the metal nanoparticles was localized in the LC cavities, which eventually accumulates on the cathode surface by electrochemical deposition. The lyotropic LC was prepared with the composition of surfactant, oil phase, and aqueous phase. In the experiment, anionic surfactant sodium bis(2-ethylhexyl) sulfosuccinate (AOT; 98%, mass fraction) was used as the surfactant; -xylene (99%, mass fraction) was used as the oil phase; and the aqueous phase was designed as solution with a concentration of 0.3 mol/L. First, 6.353 g of AOT was dissolved in 10 mL -xylene and stirred until completely dissolved. Then, 2.521 mL silver nitrate solution was added dropwise with a pipette gun. The mixture was stirred for 1 h. The stirred solution was then placed in a 20°C constant temperature tank for 2 h. Microphase separation took place between the incompatible moieties, which was finally stabilized by AOT and produced a lyotropic liquid crystalline phase with a water-in-oil anti-micelle hexagonal structure, as shown in Fig. 5(a).
![]()
Figure 5.Schematic representation of the electrochemical deposition of the SERS substrate: (a) phase states of lyotropic LC; (b) synergistic growth process of silver nanoflowers in electrodeposition.
In order to compare the influence of the electrode surface flatness on the uniformity of the deposited nanoparticle distribution, silver plate and ITO glass were chosen as the anode, while the cathode is ITO glass. The silver plate was ground by sandpaper to remove the surface oxides. A plastic spacer with a thickness of 600 µm was used as a spacer between the electrodes. It can help keep a constant distance between the two plates. During the electrochemical deposition, the cell was immersed in the lyotropic LC. DC voltage of 5 V was applied to the two electrodes. Afterwards, the whole reaction device was placed in the 20°C constant temperature tank for 3 h.
During electrodeposition, the localized silver ions in the aqueous phase would start ordered growth within the lyotropic LC soft template. After 3 h, the silver ions nucleated gradually, which eventually broke the restriction of the soft template and deposited on the cathode surface, as shown in Fig. 5(b). After electrodeposition, the LC cartridge was immersed in analytical-reagent ethanol until the two electrode plates were separated. Cathodes covered with the nanoparticles were ultrasound cleaned using ethanol for 15 min and then dried by slow flow with , which finally produced the target SERS substrate.
The surface morphology of the SERS substrate prepared with the silver plate and ITO glass as anodes was characterized by a thermal field emission scanning electron microscope (SEM, Zeiss, Baden-Wurttemberg, Germany), respectively. The extra high tension was set to 2 kV. The working distance was set to 4.1 mm.
For the SERS substrates obtained from a silver plate or ITO glass anode, SEM observations were carried out at five different positions [Fig. 6(a)]. The surface morphologies at four corners and in the middle of the substrate were recorded and compared. When the silver plate was used as the anode, obvious nonuniformity in both nanoparticle size and density was detected for the substrate [Fig. 6(b)–6(f)], although a charming nanoflower structure was formed during silver deposition [Fig. 6(g)]. It can be clearly seen that relatively smaller nanoparticles with denser packing took place at Position 5 instead of the other positions.
![]()
Figure 6.SEM characterization of the SERS substrate prepared with the silver plate as an anode: (a) the five chosen positions on the fabricated SERS substrate; (b)–(f) surface morphologies at Positions 1–5; (g) zoom-in image of the formed silver nanoflower.
The same investigation was performed on the substrate from an ITO glass anode. As shown in Fig. 7, an excellent consistency was achieved. At all the five positions, the silver nanoflowers present similar size. Meanwhile, they were closely packed and almost merged to form a uniform surface.
![]()
Figure 7.(a)–(e) Surface morphologies at Positions 1–5 of the SERS substrate prepared with the ITO glass as an anode.
3.3. Calculation of the surface homogeneity of the SERS substrate
Based on the SEM results of the prepared SERS substrates, the surface coverage at different positions was calculated by image processing. The images were binarized, as shown in Fig. 8: the white area of the picture indicates the silver nanoflowers, while the black area corresponds to the gap between the nanoparticles.
![]()
Figure 8.SEM images used for surface coverage calculation: (a) gray-scale image; (b) binarized image.
To simplify the calculation, the SERS substrate is regarded as a two-dimensional plane structure. Thus, the surface coverage of the measured region can be written as[43]
![]()
Figure 9.Comparison of surface coverage of SERS substrates fabricated from the silver plate and ITO glass anodes.
The SERS substrate surface homogeneity may be quantitatively evaluated as the following:
4. Results and Discussion
4.1. Effect of the distance of electrodes on surface homogeneity
To study the effect of the distance of electrodes on surface homogeneity of the SERS substrate, the distance distribution between the two electrodes of the silver plate and the ITO glass needs to be analyzed. According to the measured results shown in Fig. 4, a simplified schematic representation of the distance of electrodes was established, as shown in Fig. 10. As the thickness of the spacer is 600 µm, is selected as the reference distance, and then, the change of the distance is calculated. For the LC cell fabricated with silver plate, the minimum distance of electrodes should be , and the maximum is . Similarly, the distance between two ITO glass electrodes should lie in the interval [, ]. With the established model, the deposited metal particles may be simulated according to Eq. (1), and then the surface homogeneity of the SERS substrate may be obtained. Moreover, by combining the measured distance variance (Fig. 4) and the surface coverage (Fig. 10), the effect of distance may also be evaluated to the surface coverage. To the silver plate, as the reference distance of 600 µm is the minimum distance of electrodes, the corresponding measured surface coverage should be maximum. But, the reference distance of 600 µm is the maximum distance of electrodes for the ITO glass anode, so it corresponds to the minimum measured surface coverage. Consequently, for the reference distance equaling 600 µm, the reference surface coverages of the SERS substrates fabricated with silver plate and ITO glass are selected as the maximum and minimum values, respectively.
![]()
Figure 10.Schematic diagram of the distance of electrodes with the silver plate (left) and the ITO glass (right) as the anode.
In order to evaluate the effect of distance on the surface homogeneity, the relative error was defined as
![]()
Figure 11.Comparison of the simulation and experimental surface distribution uniformity of the SERS substrate fabricated from (a) a silver plate anode and (b) an ITO glass anode.
4.2. Raman spectrum uniformity of the SERS substrate
To investigate the effect of the electrode plate surface flatness on the SERS substrate Raman spectrum, Raman spectroscopy measurements were performed using a HORIBA LabRAM HR Raman spectrometer with the dye rhodamine 6G (R6G) as a probe. The working wavelength of Raman spectrometer is 532 nm. The integration time is 10 s. The laser power is 0.5 mW.
For a more convincing comparison, the positions measured in the Raman spectrometer measurements were the same as that of the SEM. Also, the Raman spectrum uniformity of the SERS substrates prepared using the silver plate or the ITO glass was compared. The coefficient of variation is used to exhibit the spectrum uniformity of the SERS substrate, which is defined as[44]
As the substrates with deposited silver nanoparticles were designed for SERS, their enhancements in spectrum intensity were studied. The Raman spectra were collected at Positions 1–5 for both substrates under the same experimental conditions. With a R6G probe, sharp and strong Raman vibration peaks were detected at the SERS-active substrates [Figs. 12(a) and 12(b)]. The intensities of the strongest characteristic peaks at were checked and compared. To eliminate the single test error, a mean value for each position was concluded from five measurements at the same location. As shown in Fig. 12(c), the smaller spectrum intensity fluctuation was achieved when ITO glass served as the anode during electrodeposition. Concretely, benefitting from the more uniformly covered silver nanoflowers, a better spectrum uniformity was also realized for the ITO glass produced substrate, for which the coefficient of variation was as small as 3.1%, while that associates with the silver plate significantly increased up to 14.9%. This reveals that the distance of electrodes could primarily affect the spectrum uniformity.
![]()
Figure 12.Raman spectrum detected at different positions of the substrate fabricated from (a) a silver plate anode and (b) an ITO glass anode; (c) comparison of their peak intensities at 613 cm-1; (d) Raman spectroscopy detection of R6G on a silicon wafer.
The enhancement effect of SERS material was evaluated by the enhancement factor (EF). R6G was used as the probe molecule in the experiment. Calculations were based on the following formula:
The EF for the SERS substrate was calculated from the Raman spectral intensity in Fig. 12. The average of the Raman spectral intensity on the surface of the SERS substrate was used as the value for . Therefore, of the silver plate as an anode is 20,338.8, and of ITO glass as an anode is 26,577.2. The value is 375.6. According to Eq. (6), the EF of the SERS substrate was for the silver plate as the anode and for the ITO glass as the anode.
5. Conclusions
In this study, we explored the effect of the surface flatness of the electrodes on the uniformity of metal particle distribution on the surface of the prepared SERS substrate, as well as the Raman spectrum intensity. Simulations were first performed to relate the electrode surface flatness to the number of deposited metal particles. To support the theoretical results, experiments were carried out with a rough and pitted silver plate anode or a smooth and slightly curved ITO glass anode during electrodeposition. According to SEM characterization and surface coverage calculation, higher surface homogeneity was achieved by the substrate fabricated from an ITO glass anode, which also showed a nice agreement with the simulations. More importantly, the SERS-active substrate obtained from flat ITO electrodes showed both high EF and excellent positional uniformity in the Raman spectrum. Our results not only evidenced the strong relationship between the electrode surface flatness and the SERS signal uniformity, but also opened an avenue for the fabrication of SERS-active substrates with high performance and low cost.

Set citation alerts for the article
Please enter your email address
© Copyright 2018-2021 | Chinese Laser Press. All Rights Reserved 沪ICP备15018463号-20