• Laser & Optoelectronics Progress
  • Vol. 59, Issue 4, 0410007 (2022)
Didi Zhao1、2、3, Jiahui Li1、2、3, Fenli Tan1、2、3, Chenxin Zeng1、2、3, and Yiqun Ji1、2、3、*
Author Affiliations
  • 1School of Optoelectronic Science and Engineering, Soochow University, Suzhou , Jiangsu 215006, China
  • 2Key Laboratory of Advanced Optical Manufacturing Technologies of Jiangsu Province, Soochow University, Suzhou , Jiangsu 215006, China
  • 3Key Laboratory of Modern Optical Technologies of Education Ministry China, Soochow University, Suzhou , Jiangsu 215006, China
  • show less
    DOI: 10.3788/LOP202259.0410007 Cite this Article Set citation alerts
    Didi Zhao, Jiahui Li, Fenli Tan, Chenxin Zeng, Yiqun Ji. Remote Sensing Image Mosaic Based on Distribution Measure and Saliency Information[J]. Laser & Optoelectronics Progress, 2022, 59(4): 0410007 Copy Citation Text show less
    Overall workflow of the two image stitching
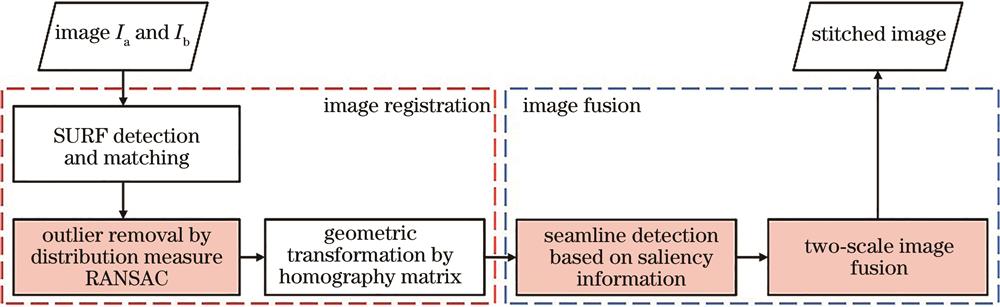
    Fig. 1. Overall workflow of the two image stitching
    Distribution measure RANSAC algorithm
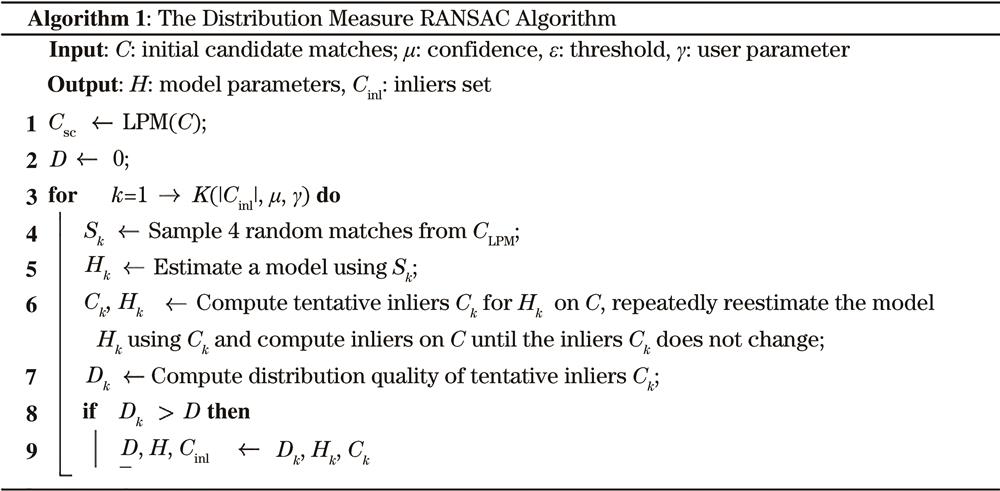
    Fig. 2. Distribution measure RANSAC algorithm
    Schematic of optimal inlier selection. (a) Tentative inliers Ck, |Ck|=231; (b) tentative inliers Ck+1, |Ck+1|=220; (c) Delaunay triangulation constructed according to Ck, Dk=3.474; (d) Delaunay triangulation constructed according to Ck+1, Dk+1=2.1361
    Fig. 3. Schematic of optimal inlier selection. (a) Tentative inliers Ck, |Ck|=231; (b) tentative inliers Ck+1, |Ck+1|=220; (c) Delaunay triangulation constructed according to Ck, Dk=3.474; (d) Delaunay triangulation constructed according to Ck+1, Dk+1=2.1361
    Schematic of saliency information extraction in remote sensing image. (a) Line segment detection result; (b) saliency information map
    Fig. 4. Schematic of saliency information extraction in remote sensing image. (a) Line segment detection result; (b) saliency information map
    Two-scale image fusion
    Fig. 5. Two-scale image fusion
    Three pairs of remote sensing images
    Fig. 6. Three pairs of remote sensing images
    Quantitative analysis of algorithm performance. (a) MI; (b) FSIM
    Fig. 7. Quantitative analysis of algorithm performance. (a) MI; (b) FSIM
    Comparison of seamline detection and smooth transition fusion of four algorithms. (a) Seamline of Chon's algorithm; (b) seamline of HVDA algorithm; (c) seamline of QESE algorithm; (d) seamline of proposed algorithm; (e)‒(h) enlargements of corresponding box area
    Fig. 8. Comparison of seamline detection and smooth transition fusion of four algorithms. (a) Seamline of Chon's algorithm; (b) seamline of HVDA algorithm; (c) seamline of QESE algorithm; (d) seamline of proposed algorithm; (e)‒(h) enlargements of corresponding box area
    Mosaic comparison of remote sensing sequence images. (a) AutoStitch; (b) ICE; (c) QESE; (d) proposed algorithm; (e)‒(h) enlargements of corresponding box area
    Fig. 9. Mosaic comparison of remote sensing sequence images. (a) AutoStitch; (b) ICE; (c) QESE; (d) proposed algorithm; (e)‒(h) enlargements of corresponding box area
    ParameterChon’sHVDAQESEProposed algorithm
    SSIM0.88410.850.88150.9098
    PSNR29.08627.82230.597931.3778
    Time /s311.695739.2018470.209231.5509
    Table 1. Quantitative analysis of each algorithm for seamline detection and two-scale fusion
    Didi Zhao, Jiahui Li, Fenli Tan, Chenxin Zeng, Yiqun Ji. Remote Sensing Image Mosaic Based on Distribution Measure and Saliency Information[J]. Laser & Optoelectronics Progress, 2022, 59(4): 0410007
    Download Citation