
Shuang Wang, Haishan Zeng. Real-Time in vivo Raman Spectroscopy and Its Clinical Applications in Early Cancer Detection[J]. Chinese Journal of Lasers, 2018, 45(2): 207002
- Chinese Journal of Lasers
- Vol. 45, Issue 2, 207002 (2018)
![Schematic of the potential light-tissue interactions, shown specifically in lung tissue[5]](/richHtml/zgjg/2018/45/2/0207002/img_1.jpg)
Fig. 1. Schematic of the potential light-tissue interactions, shown specifically in lung tissue[5]
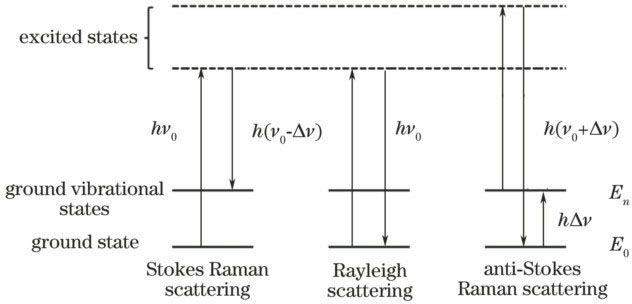
Fig. 2. Schematic of Raman scattering
Fig. 3. Raman probe designs for endoscopic and open-field biomedical applications[5]. (a) Bevelled collection fibers with in-line filter; (b) probe with front mounted filtering; (c) lung endoscopic Raman probe with first stage filtering coating on distal tip and second stage high performance filtering at proximal end; (d) compound parabolic concentrator Raman probe; (e) Raman probe for cervical disease detection; (f) Raman probe for skin disease detection
Fig. 4. (a) Diagram of the integrated real-time rapid Raman spectrometer system for skin cancer detection; (b) diagram of the specially designed skin Raman probe[43]
Fig. 5. Schematic configuration of the real-time Raman system for skin cancer diagnosis[42]
Fig. 6. Mean Raman spectra of different skin lesions[42]. (a) Full-range spectral results displayed from 500 cm-1 to 1800 cm-1; (b) spectral results plotted for lower frequency range only (500-1055 cm-1) show variability according to lesion diagnosis. AK, actinic keratosis; AN, atypical nevus; BCC, basal cell carcinoma; BN, blue nevus; CN, compound nevus; IN, intradermal nevus; JN, junctional nevus; MM, malignant melanoma; SCC, squamous cell carcinoma; SK, seborrheic keratosis
Fig. 7. Lesion classification by Raman spectroscopy based on PC-GDA. Posterior probabilities for discriminating (a) skin cancers and precancers (cancer+actinic keratosis, including MM, BCC, SCC, AK, n=232) from benign skin disorders (including atypical nevi, blue nevi, compound nevi, intradermal nevi, junctional nevi, seborrheic keratosis, n=286), (b) melanoma (n=44) from benign pigmented skin diseases (including atypical nevi, blue nevi, compound nevi, intradermal nevi, junctional nevi, seborrheic kera
Fig. 8. Schematic of the endoscopic laser Raman spectroscopy system[73]. The inserts show the arrangement of the excitation (red) and collection (green) fibers. The collection fibers were connected to the spectrograph through a special round to parabolic fiber bundle to achieve better signal-to-noise ratio
Fig. 9. Pictures showing images acquired by a bronchoscopy Raman system[79]. (a) White light bronchoscopic image; (b) blue light excited fluorescence image of the same location as (a), green is representative of normal tissue, and dark red (center of image) is diseased tissue; (c) same lesion being excited simultaneously with blue light to generate a fluorescence image and with 785 nm light from the Raman catheter, the field of view is about 2 cm
Fig. 10. Mean Raman spectra by diagnosis (all spectra normalized to their respective area under curve before averaging by diagnosis) [73]
Fig. 11. Lesion classification by Raman spectroscopy based on STEP PC-GDA[73]. (a) Posterior probability plot for distinguishing cancerous lesions (HGD, CIS and invasive cancer; n=72) from benign lesions (mild dysplasia, metaplasia, hyperplasia, inflammation and normal; n=208); (b) ROC curves and 95% CIs derived from the posterior probabilities; (c) box plot representation of the posterior probability distributions according to lesion subcategories

Set citation alerts for the article
Please enter your email address
© Copyright 2018-2021 | Chinese Laser Press. All Rights Reserved 沪ICP备15018463号-20