• Journal of Infrared and Millimeter Waves
  • Vol. 39, Issue 4, 491 (2020)
Xiao-Ying LIU1, Song-Hua WU2、*, Hong-Wei ZHANG1, Zhi-Qiang HE3, Jian-Jun ZHANG3, Xiao-Ye WANG1, and Xiao-Min CHEN1
Author Affiliations
  • 1Institute for Advanced Ocean Study, College of Information Science and Engineering, Ocean Remote Sensing Institute, Ocean University of China,Qingdao26600,China
  • 2Institute for Advanced Ocean Study, College of Information Science and Engineering, Ocean Remote Sensing Institute, Ocean University of China,Qingdao26600,China
  • 3North China Regional Air Traffic Management Bureau of CAAC, Beijing100621, China
  • show less
    DOI: 10.11972/j.issn.1001-9014.2020.04.014 Cite this Article
    Xiao-Ying LIU, Song-Hua WU, Hong-Wei ZHANG, Zhi-Qiang HE, Jian-Jun ZHANG, Xiao-Ye WANG, Xiao-Min CHEN. Low-level wind shear observation based on different physical mechanisms by coherent Doppler lidar[J]. Journal of Infrared and Millimeter Waves, 2020, 39(4): 491 Copy Citation Text show less
    Wind3D 6000 scanning wind lidar
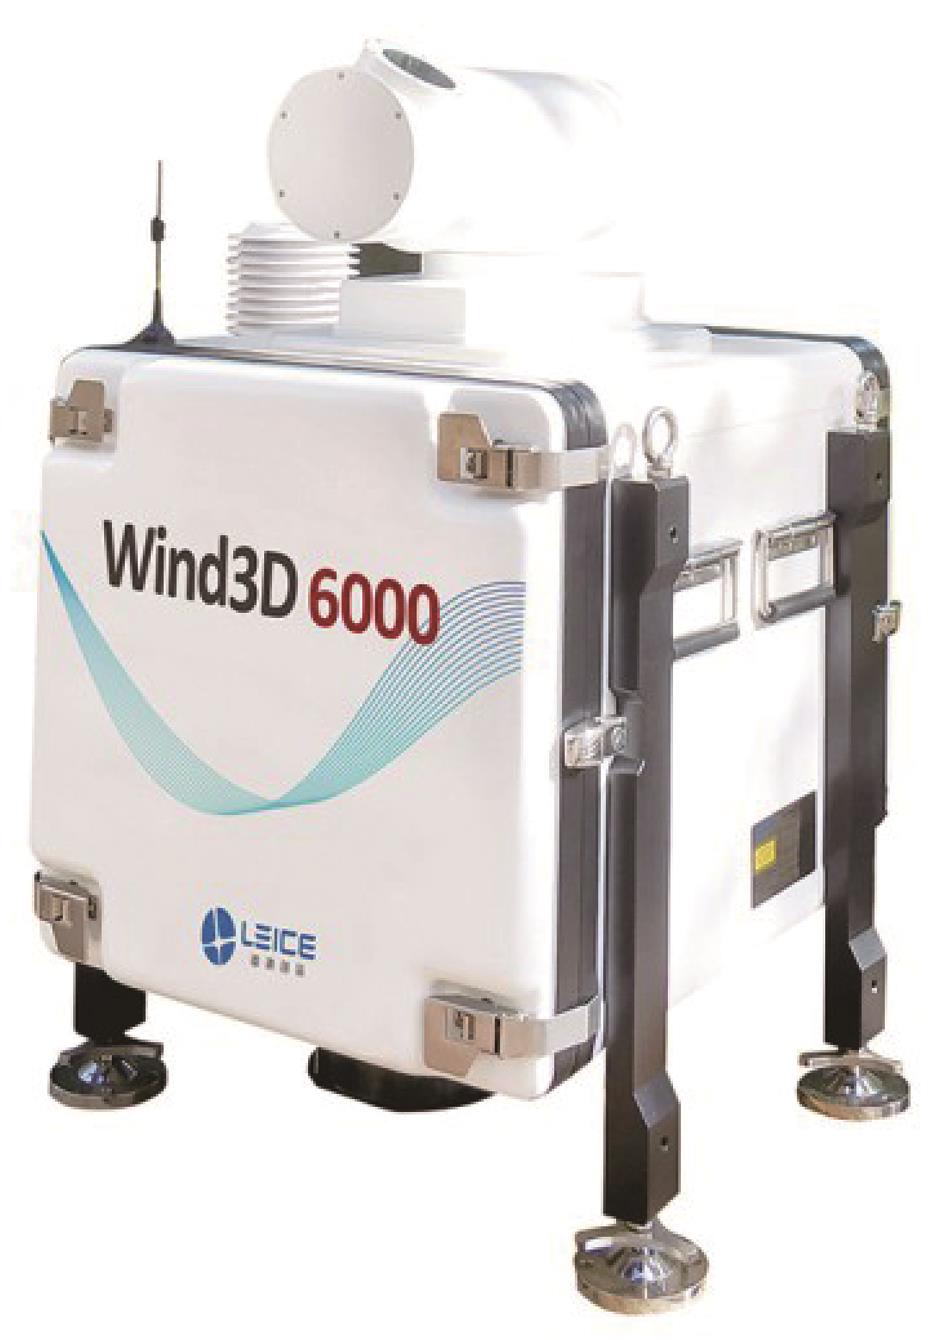
    Fig. 1. Wind3D 6000 scanning wind lidar
    The geographical environment around Beijing Capital International Airport and locations of lidars (a) the first phase of experiment from January 2018 to October 2018,(b) the second phase of experiment from November 2018 to October 2019
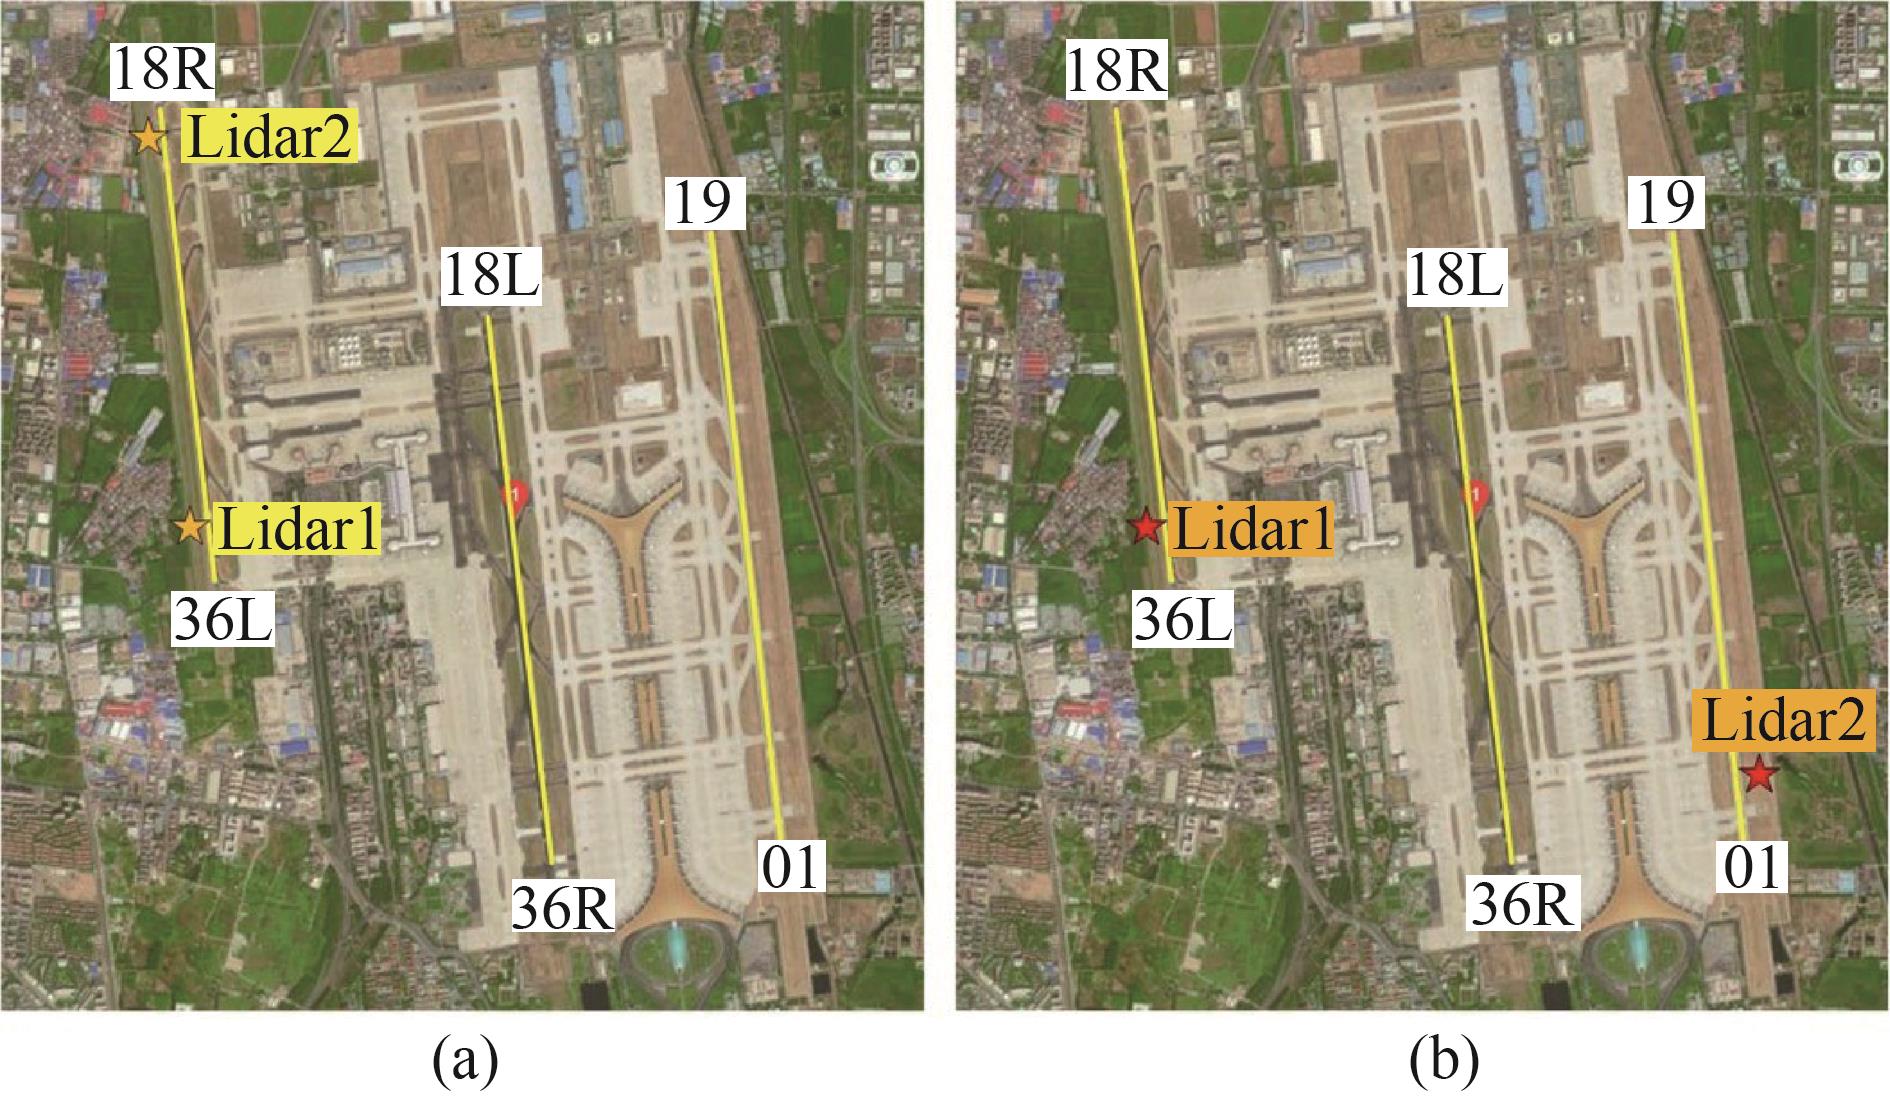
    Fig. 2. The geographical environment around Beijing Capital International Airport and locations of lidars (a) the first phase of experiment from January 2018 to October 2018,(b) the second phase of experiment from November 2018 to October 2019
    Schematic diagram for DBS wind profile scanning mode of lidar under different weather conditions (a) dry thunderstorms, (b) sunny day
    Fig. 3. Schematic diagram for DBS wind profile scanning mode of lidar under different weather conditions (a) dry thunderstorms, (b) sunny day
    Schematic diagram for glide path scanning mode of lidar
    Fig. 4. Schematic diagram for glide path scanning mode of lidar
    Wind shear identification of DBS method (a) flow chart of wind shear identification, (b) the wind shear heights
    Fig. 5. Wind shear identification of DBS method (a) flow chart of wind shear identification, (b) the wind shear heights
    Flow chart of wind shear identification by glide path method
    Fig. 6. Flow chart of wind shear identification by glide path method
    500 hPa synoptic chart on June 29, 2018
    Fig. 7. 500 hPa synoptic chart on June 29, 2018
    Wind velocity and direction measured by lidar during dry thunderstorms on June 29, 2018 (a) wind velocity gradient, (b) wind direction
    Fig. 8. Wind velocity and direction measured by lidar during dry thunderstorms on June 29, 2018 (a) wind velocity gradient, (b) wind direction
    THI (Time Height Intensity) of vertical wind velocity measured by lidar
    Fig. 9. THI (Time Height Intensity) of vertical wind velocity measured by lidar
    Lidar wind velocity time series at different heights (above ground level) at 36L and 18R corridor (a)100 m,(b)300 m
    Fig. 10. Lidar wind velocity time series at different heights (above ground level) at 36L and 18R corridor (a)100 m,(b)300 m
    Wind shear alerting of lidar at different time during dry thunderstorms (a) 15:05-15:10,(b)15:15-15:20,(c)16:00-16:05,(d)16:05-16:10, (e)16:10-16:15,(f)16:15-16:20,(g)16:20-16:25,(h)16:25-16:30
    Fig. 11. Wind shear alerting of lidar at different time during dry thunderstorms (a) 15:05-15:10,(b)15:15-15:20,(c)16:00-16:05,(d)16:05-16:10, (e)16:10-16:15,(f)16:15-16:20,(g)16:20-16:25,(h)16:25-16:30
    500 hPa synoptic chart on May 19, 2019
    Fig. 12. 500 hPa synoptic chart on May 19, 2019
    High altitude-surface synoptic analysis chart on May 19, 2019
    Fig. 13. High altitude-surface synoptic analysis chart on May 19, 2019
    Radar surface synoptic chart on May 19, 2019
    Fig. 14. Radar surface synoptic chart on May 19, 2019
    Background wind field measured by lidar on May 19, 2019 (a) wind velocity,(b) wind direction
    Fig. 15. Background wind field measured by lidar on May 19, 2019 (a) wind velocity,(b) wind direction
    Wind shear alerting information of lidar at 36L runway corridor on May 19, 2019(a) radial velocity, (b) head wind profile retrieved from the glide path scanning mode
    Fig. 16. Wind shear alerting information of lidar at 36L runway corridor on May 19, 2019(a) radial velocity, (b) head wind profile retrieved from the glide path scanning mode
    Radial wind velocity measured by lidar at 36L runway corridor on May 19, 2019 (a) 17:04:17, (b)17:08:41, (c)17:10:16, (d)17:11:51, (e)17:16:28, (f)17:18:03
    Fig. 17. Radial wind velocity measured by lidar at 36L runway corridor on May 19, 2019 (a) 17:04:17, (b)17:08:41, (c)17:10:16, (d)17:11:51, (e)17:16:28, (f)17:18:03
    Wind shear alerting information of lidar at 01 runway corridor on May 19, 2019 (a) radial velocity, (b) head wind profile retrieved from the glide path scanning mode
    Fig. 18. Wind shear alerting information of lidar at 01 runway corridor on May 19, 2019 (a) radial velocity, (b) head wind profile retrieved from the glide path scanning mode
    Radial wind velocity measured by lidar at 01 runway corridor on May 19, 2019 (a) 17:01:56, (b)17:04:37, (c)17:07:50, (d)17:11:10, (e)17:13:50, (f)17:17:05
    Fig. 19. Radial wind velocity measured by lidar at 01 runway corridor on May 19, 2019 (a) 17:01:56, (b)17:04:37, (c)17:07:50, (d)17:11:10, (e)17:13:50, (f)17:17:05
    航空气象学分类一:风场结构[1]

    风的垂直切变

    (Vertical Wind Shear)

    水平风在垂直方向上一定距离内,两点之间的风速和(或)风向的变化。

    风的水平切变

    (Horizontal Wind Shear)

    水平风在水平方向上两点之间风速和(或)风向的变化。

    垂直气流切变

    (Vertical Air Current Shear)

    上升或下曳气流(垂直风)在水平方向上两点之间的变化。
    航空气象学分类二:飞机航迹相对于风矢量的方位[1,2,5]

    顺风切变

    (Tail Wind Shear)

    飞机从小的顺风区进入大的顺风区,或从逆风区进入顺风区以及从大的逆风区进入小的逆风区等情形,它使飞机空速减小,升力下降,是一种比较危险的风切变形式。

    逆风切变

    (Head Wind Shear)

    飞机从小的逆风区进入大的逆风区,或从顺风区进入无风或逆风区以及从大顺风区进入小顺风区等情形,它使飞机空速增加,升力增大,比顺风切变的危害相对轻些。

    侧风切变

    (Cross Wind Shear)

    飞机从一种侧风或无侧风状态,进入另一种明显不同的侧风状态,分左侧风切变和右侧风切变,它使飞机发生偏航、侧滑、滚转等现象,侧风较强且风速变化大时也很危险。

    垂直气流切变

    (Vertical Air Current Shear)

    飞机从无明显升降气流区,进入强烈升降气流区的情形,特别是强烈的下击暴流,具有猝发性,使飞机突然下沉,危害最大。
    风切变探测领域:气象雷达散射回波信号强弱[6]

    湿性风切变

    (Wet Wind Shear)

    指由雷暴等强对流天气、锋面等天气活动引发的风切变,伴随有降雨,通常采用多普勒天气雷达进行探测。

    干性风切变

    (Dry Wind Shear)

    又称晴空风切变,指由辐射逆温、地形障碍物等引起的风切变,通常发生在晴空条件下,一般采用激光雷达进行观测。
    Table 1. 低空风切变类型
    观测设备工作原理优势局限性
    地基超声风速计根据声波脉冲从发射端到达接收端的时间或频率差反演风速和风向。风速测量精度高、流场破坏小等优点。1)超声风速计为点测量,无法获得整个风场的空间分布;2)只能探测地面高度的水平风切变;3)无法观测地形诱导下的高时空变化的低空风切变;4)阵风情况下,不理想的风速计选址和较低数据质量会导致系统误报。
    声雷达通过定向发射声波信号,并根据接收到的散射信号实现大气边界层要素的反演。灵敏度高、生产成本低;能获得独特的边界层湍流的动力和热力结构。

    1)声雷达为声波探测,声波在大气中衰减很大,探测高度有限。

    2)声雷达探测易受到雨雪、噪声等多种因素影响,因而在降水和大风环境中无法使用。

    多普勒天气雷达通过发射一系列电磁波脉冲,利用云雨、雪等降水粒子对电磁波的散射反演风场结构特征和垂直气流速度。1)探测距离较远,可探测几百公里距离范围内的风场。2)能够探测湿性风切变(雷暴天气、热带气旋等强对流天气诱发的风切变)。

    1)在晴空无云的情况下探测性能低,无法实现晴空(干性)风切变观测,误报率较高。

    2)体积庞大,灵活性差,空间分辨率较低。

    Table 2. 传统风切变观测设备工作原理、优势和局限性
    发射系统参数
    工作波长1550 nm
    脉冲能量150 μJ
    脉冲宽度100 ns to 200 ns
    脉冲重复频率10 kHz
    接收、采集系统参数
    望远镜直径75 mm
    望远镜有效孔径60 mm
    平衡探测器带宽250 MHz
    平衡探测器共模抑制比>20 dB
    采样率1 GHz
    ADC 分辨率12 bits
    激光雷达测量参数
    探测距离45 ~ 6000 m
    数据更新率1 ~ 10 Hz
    距离分辨率15 ~ 30 m
    风速准确性≤ 0.1 m/s
    径向风速测量范围-37.5 ~ +37.5 m/s*
    风向准确度0.1°
    Table 3. Wind3D 6000航空气象型测风激光雷达技术指标
    试验阶段试验时间试验地点试验目的
    第一阶段2018.01–2018.10

    Lidar1:西跑道南端(36L)

    Lidar2:西跑道北端(18R)

    不同天气条件下西跑道南北两端风切变观测及风场研究
    第二阶段2018.11–2019.10

    Lidar1:西跑道南端(36L)

    Lidar2:东跑道南端(01)

    东西跑道南端地形诱导风切变观测及风场研究
    Table 4. 不同跑道端两台激光雷达同步观测试验信息
    试验阶段试验时间Lidar1和2同步扫描模式备注
    第一阶段2018.01–2018.10DBS风廓线模式/
    第二阶段2018.11–2019.10

    1)下滑道模式

    2)PPI模式

    3)RHI模式

    一个扫描周期包含前述3种模式,共计8 min,下滑道扫描时间约占60%。
    Table 5. 试验期间激光雷达风切变观测扫描模式设置
    当地时间

    风速

    (m/s)

    风向

    阵风

    (m/s)

    云量特殊天气现象
    10:001风向多变无明显的云
    10:301风向多变6少云 (10%∼30%) 1500 m, 垂直发展很旺盛的浓积云
    11:003东南偏东风无明显的云
    11:303南风无明显的云
    12:004东南偏东风少云 (10%∼30%) 1500 m, 垂直发展很旺盛的浓积云
    12:304东南偏南风少云 (10%∼30%) 1500 m, 垂直发展很旺盛的浓积云
    13:005东南偏南风少云 (10%∼30%) 1500 m, 垂直发展很旺盛的浓积云
    13:304东南偏南风少云 (10%∼30%) 1500 m, 积雨云
    14:005南风少云 (10%∼30%) 1500 m, 积雨云
    14:304西南风疏云 (40%∼50%) 1500 m, 积雨云
    15:004西南偏南风9少云 (10%∼30%) 600 m, 疏云 (40%∼50%) 990 m, 积雨云
    15:3011西北偏北风16多云 (60%∼90%) 990 m, 积雨云雷暴
    16:0011西北偏北风多云 (60%∼90%) 990 m, 积雨云轻度(小)(弱) 雷暴
    16:309东北偏北风疏云 (40%∼50%) 990 m, 积雨云轻度(小)(弱) 雷暴
    17:003东北偏北风疏云 (40%∼50%) 990 m, 积雨云雷暴
    17:309西南偏南风疏云 (40%∼50%) 990 m, 积雨云
    18:008西南偏南风少云 (10%∼30%) 990 m, 积雨云
    18:306南风无明显的云
    19:003东南偏东风无明显的云
    Table 6. 2018年6月29日北京首都国际机场(ZBAA)METAR气象数据
    风切变发生时段风切变发生高度/m最小风速/(m/s)最大风速/(m/s)风速差/(m/s)
    15:05 ~ 15:0612013.417.13.7
    30012.416.64.2
    15:15 ~ 15:1615312.115.73.6
    16:00 ~ 16:0337813.316.93.6
    16:05 ~ 16:0945312.318.15.8
    16:06 ~ 16:0911312.116.84.7
    3601218.66.6
    16:13 ~ 16:1424615.118.73.6
    16:15 ~ 16:1831012.215.83.6
    16:20 ~ 16:234201215.73.7
    16:25 ~ 16:2723812.115.93.8
    Table 7. 干性雷暴期间风切变信息一览表
    时间风向风速/(m/s)机场当前特殊天气现象总云量
    13:30从西方吹来的风14无明显的云
    14:00从西方吹来的风16无明显的云
    14:30从西北偏西方向吹来的风15无明显的云
    15:00从西方吹来的风16无明显的云
    15:30从西方吹来的风16无明显的云
    16:00从西方吹来的风14无明显的云
    16:30从西北偏西方向吹来的风14无明显的云
    17:00从西北方吹来的风14无明显的云
    17:30从西北方吹来的风14无明显的云
    18:00从西方吹来的风13无明显的云
    18:30从西北偏西方向吹来的风13无明显的云
    19:00从西北偏西方向吹来的风13无明显的云
    Table 8. 13:30–19:00(2019年5月19日)北京首都国际机场METAR气象数据
    风切变发生时间风切变发生跑道风切变发生高度区间/m风切变距离着陆点位置/m最大风速/(m/s)最小风速/(m/s)

    风速差/

    (m/s)

    风切变强度/(m1/3s-2/3
    17:0836L80 ~ 981527 ~ 187917.75.312.40.42
    17:070122 ~ 48427~92018.46.811.60.35
    Table 9. 地形诱导风切变信息一览表(2019.05.19)
    Xiao-Ying LIU, Song-Hua WU, Hong-Wei ZHANG, Zhi-Qiang HE, Jian-Jun ZHANG, Xiao-Ye WANG, Xiao-Min CHEN. Low-level wind shear observation based on different physical mechanisms by coherent Doppler lidar[J]. Journal of Infrared and Millimeter Waves, 2020, 39(4): 491
    Download Citation