
Fang Liu, Zhiwei Wu, Anzhe Yang, Xiao Han. Multi-Scale Feature Fusion Based Adaptive Object Detection for UAV[J]. Acta Optica Sinica, 2020, 40(10): 1015002
- Acta Optica Sinica
- Vol. 40, Issue 10, 1015002 (2020)
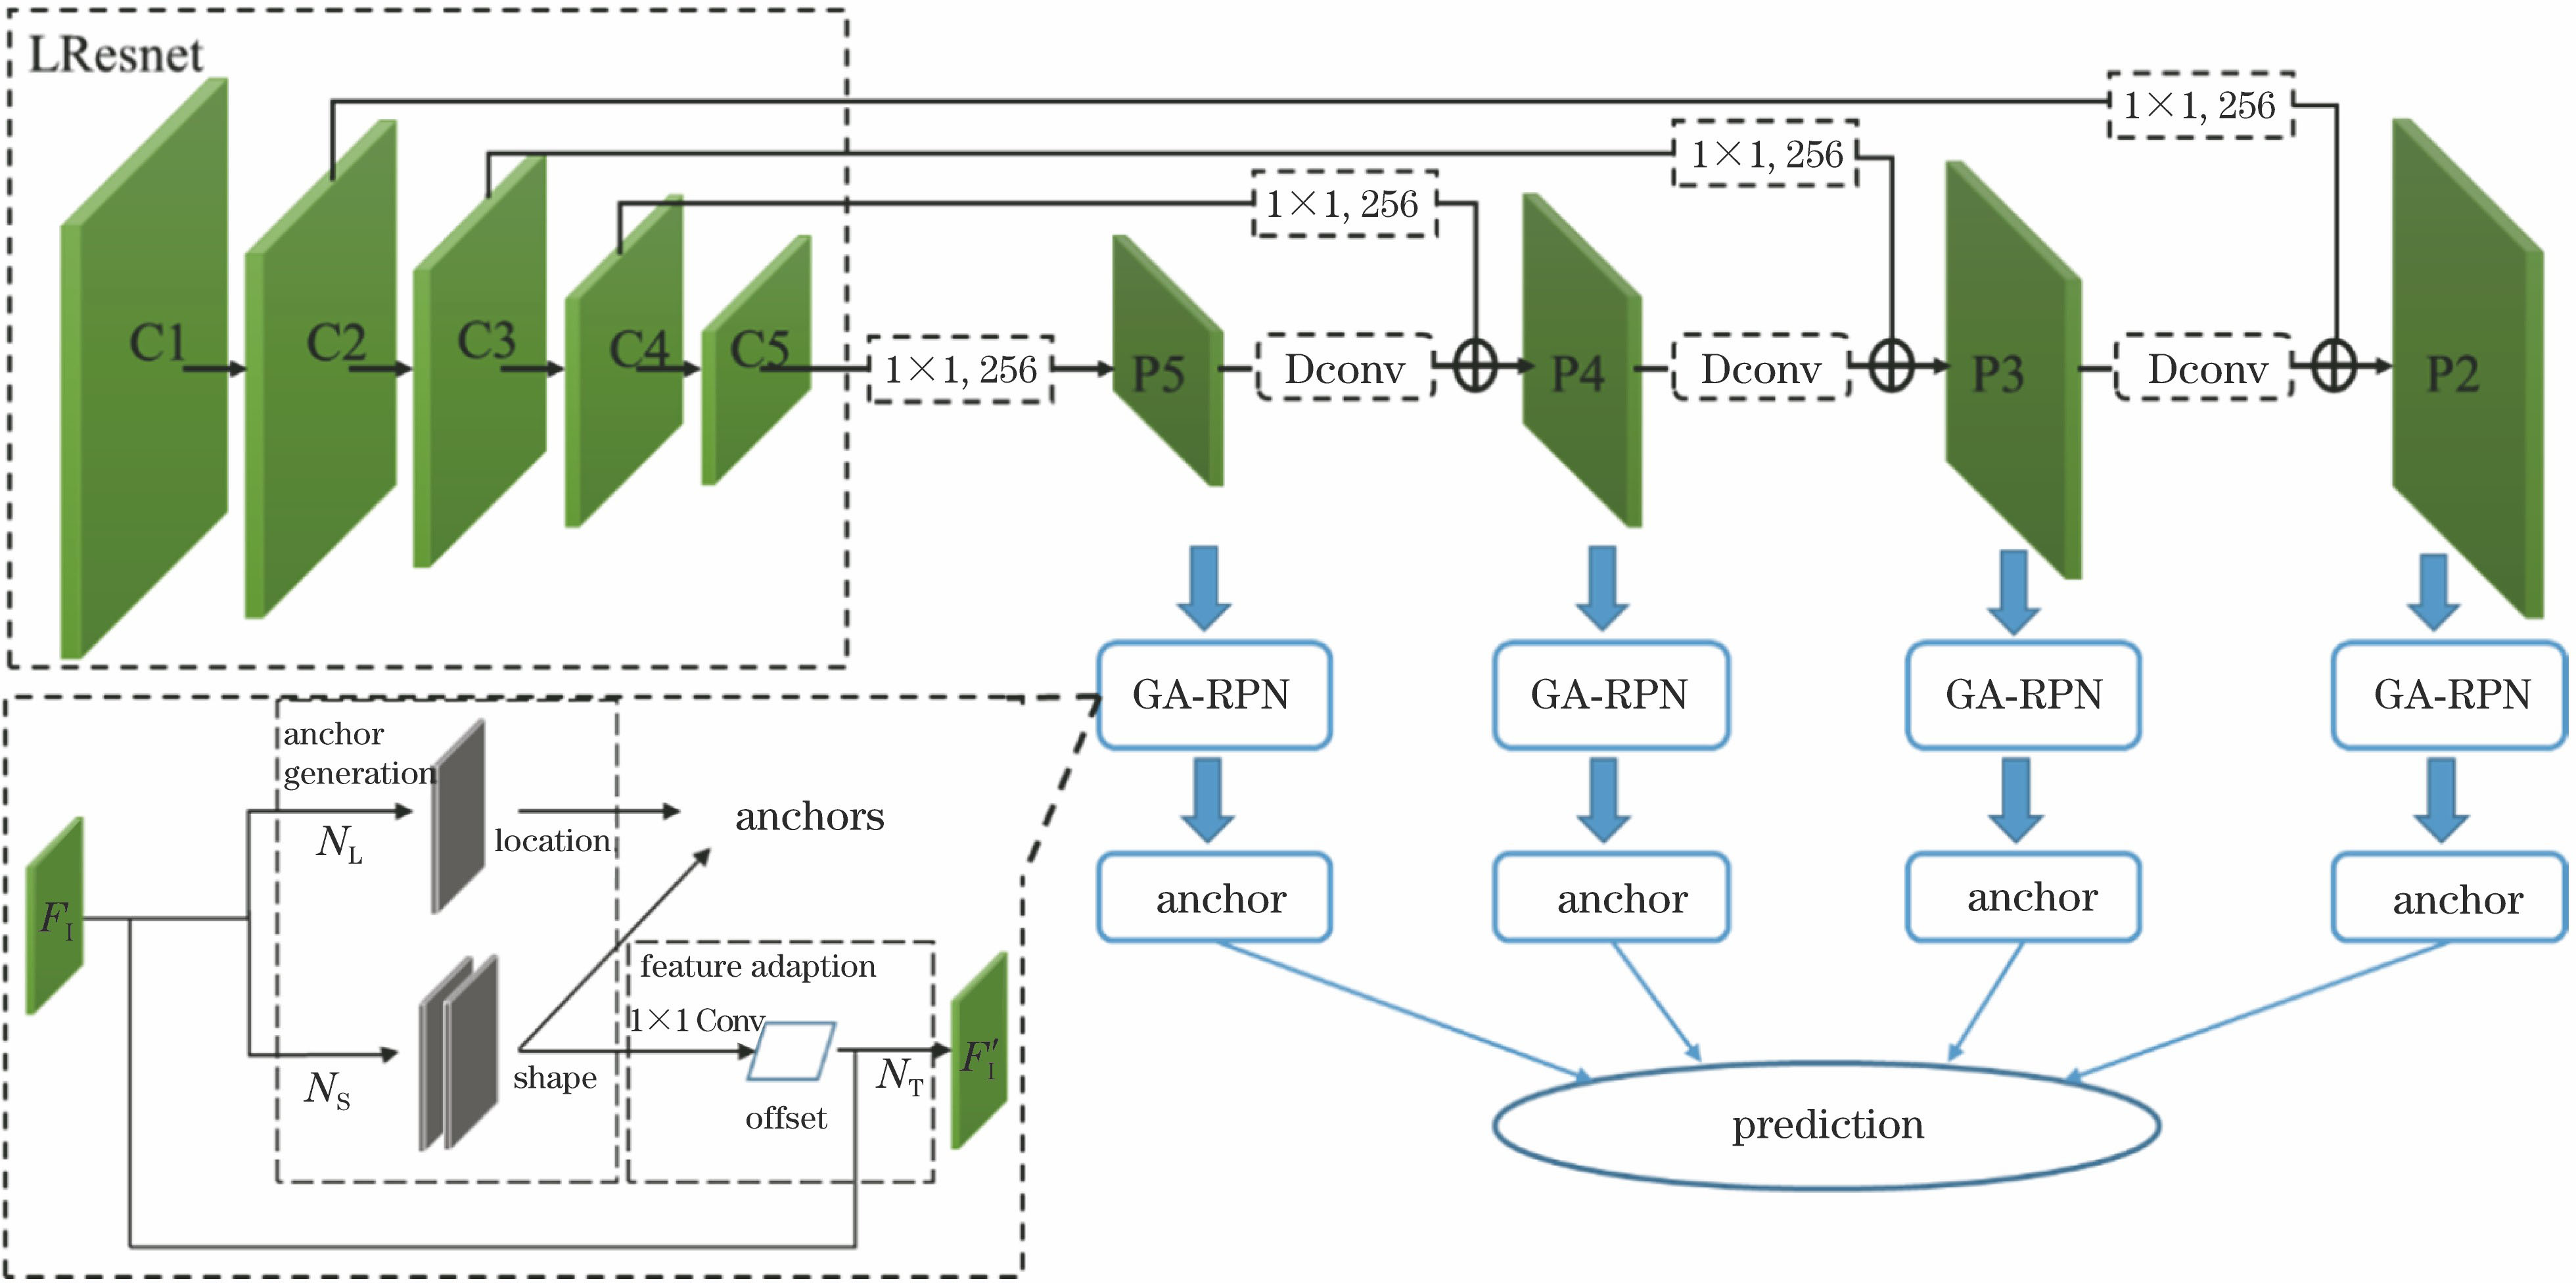
Fig. 1. Framework of our algorithm
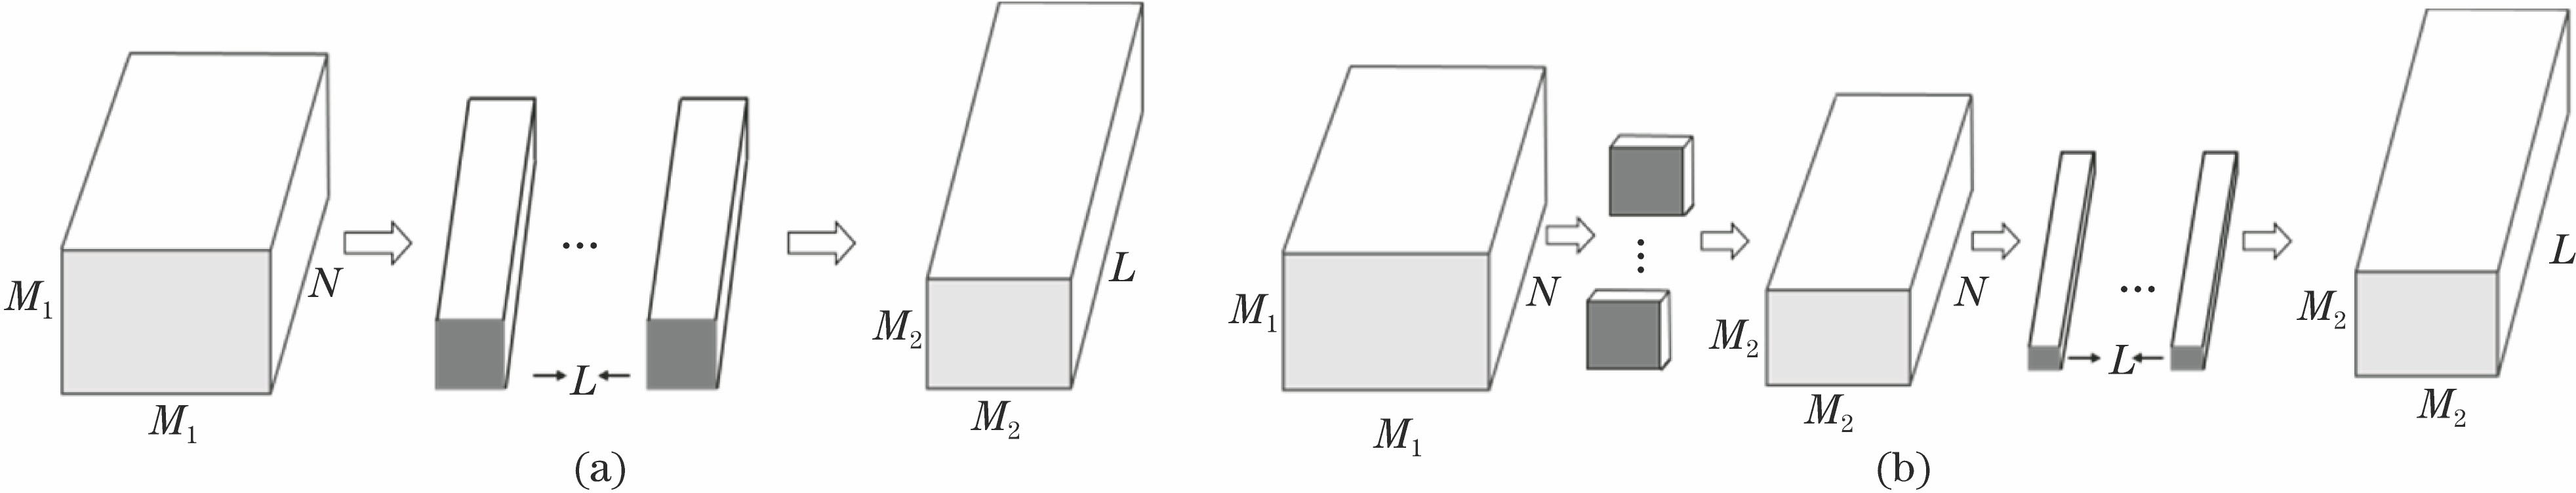
Fig. 2. Schematic diagram of convolution decomposition. (a) Standard convolution process; (b) convolution process after decomposition
Fig. 3. Convolutional neural network residualmodule structure diagram
Fig. 4. Deconvolution cascaded structure
Fig. 5. Adaptive candidate region generation
Fig. 6. Visualization detection results of the proposed algorithm in different situations. (a) Small target detection results; (b) dense target detection results;(c) detection results of target under different illuminations
|
Table 1. Lightweight deep residual network model
|
Table 2. Deconvolution layer parameters
|
Table 3. Feature extraction network comparison
|
Table 4. Effectiveness test of each module for different methods%
|
Table 5. Comparison between the results of ten categories from ours model and Faster-RCNN on VisDrone dataset%
|
Table 6. Comparison test of UAV aerial data with mainstream object detection algorithm

Set citation alerts for the article
Please enter your email address
© Copyright 2018-2021 | Chinese Laser Press. All Rights Reserved 沪ICP备15018463号-20