• Acta Optica Sinica
  • Vol. 41, Issue 6, 0606001 (2021)
Jiyang Tian1, Guangye Yang1、*, Sandan Wang2、3, and Jinpeng Yuan2、3
Author Affiliations
  • 1School of Basic Medicine, Shanxi Medical University, Taiyuan, Shanxi 0 30001, China
  • 2State Key Laboratory of Quantum Optics and Quantum Optics Devices, Institute of Laser Spectroscopy, Shanxi University, Taiyuan, Shanxi 0 30006, China
  • 3Collaborative Innovation Center of Extreme Optics, Shanxi University, Taiyuan, Shanxi 0 30006, China
  • show less
    DOI: 10.3788/AOS202141.0606001 Cite this Article Set citation alerts
    Jiyang Tian, Guangye Yang, Sandan Wang, Jinpeng Yuan. Optimization of Optical Coherence Tomography Light Source Based on Pump Pulse of Medical Photonic Crystal Fibers[J]. Acta Optica Sinica, 2021, 41(6): 0606001 Copy Citation Text show less
    Temporal and spectral distributions of the input and output recorded after 120 m of propagation for pump pulses with different central wavelengths in different fibers: PCF1, PCF2, PCF3. (a) λC=1.06 μm; (b) λC=1.31 μm; (c) λC=1.55 μm
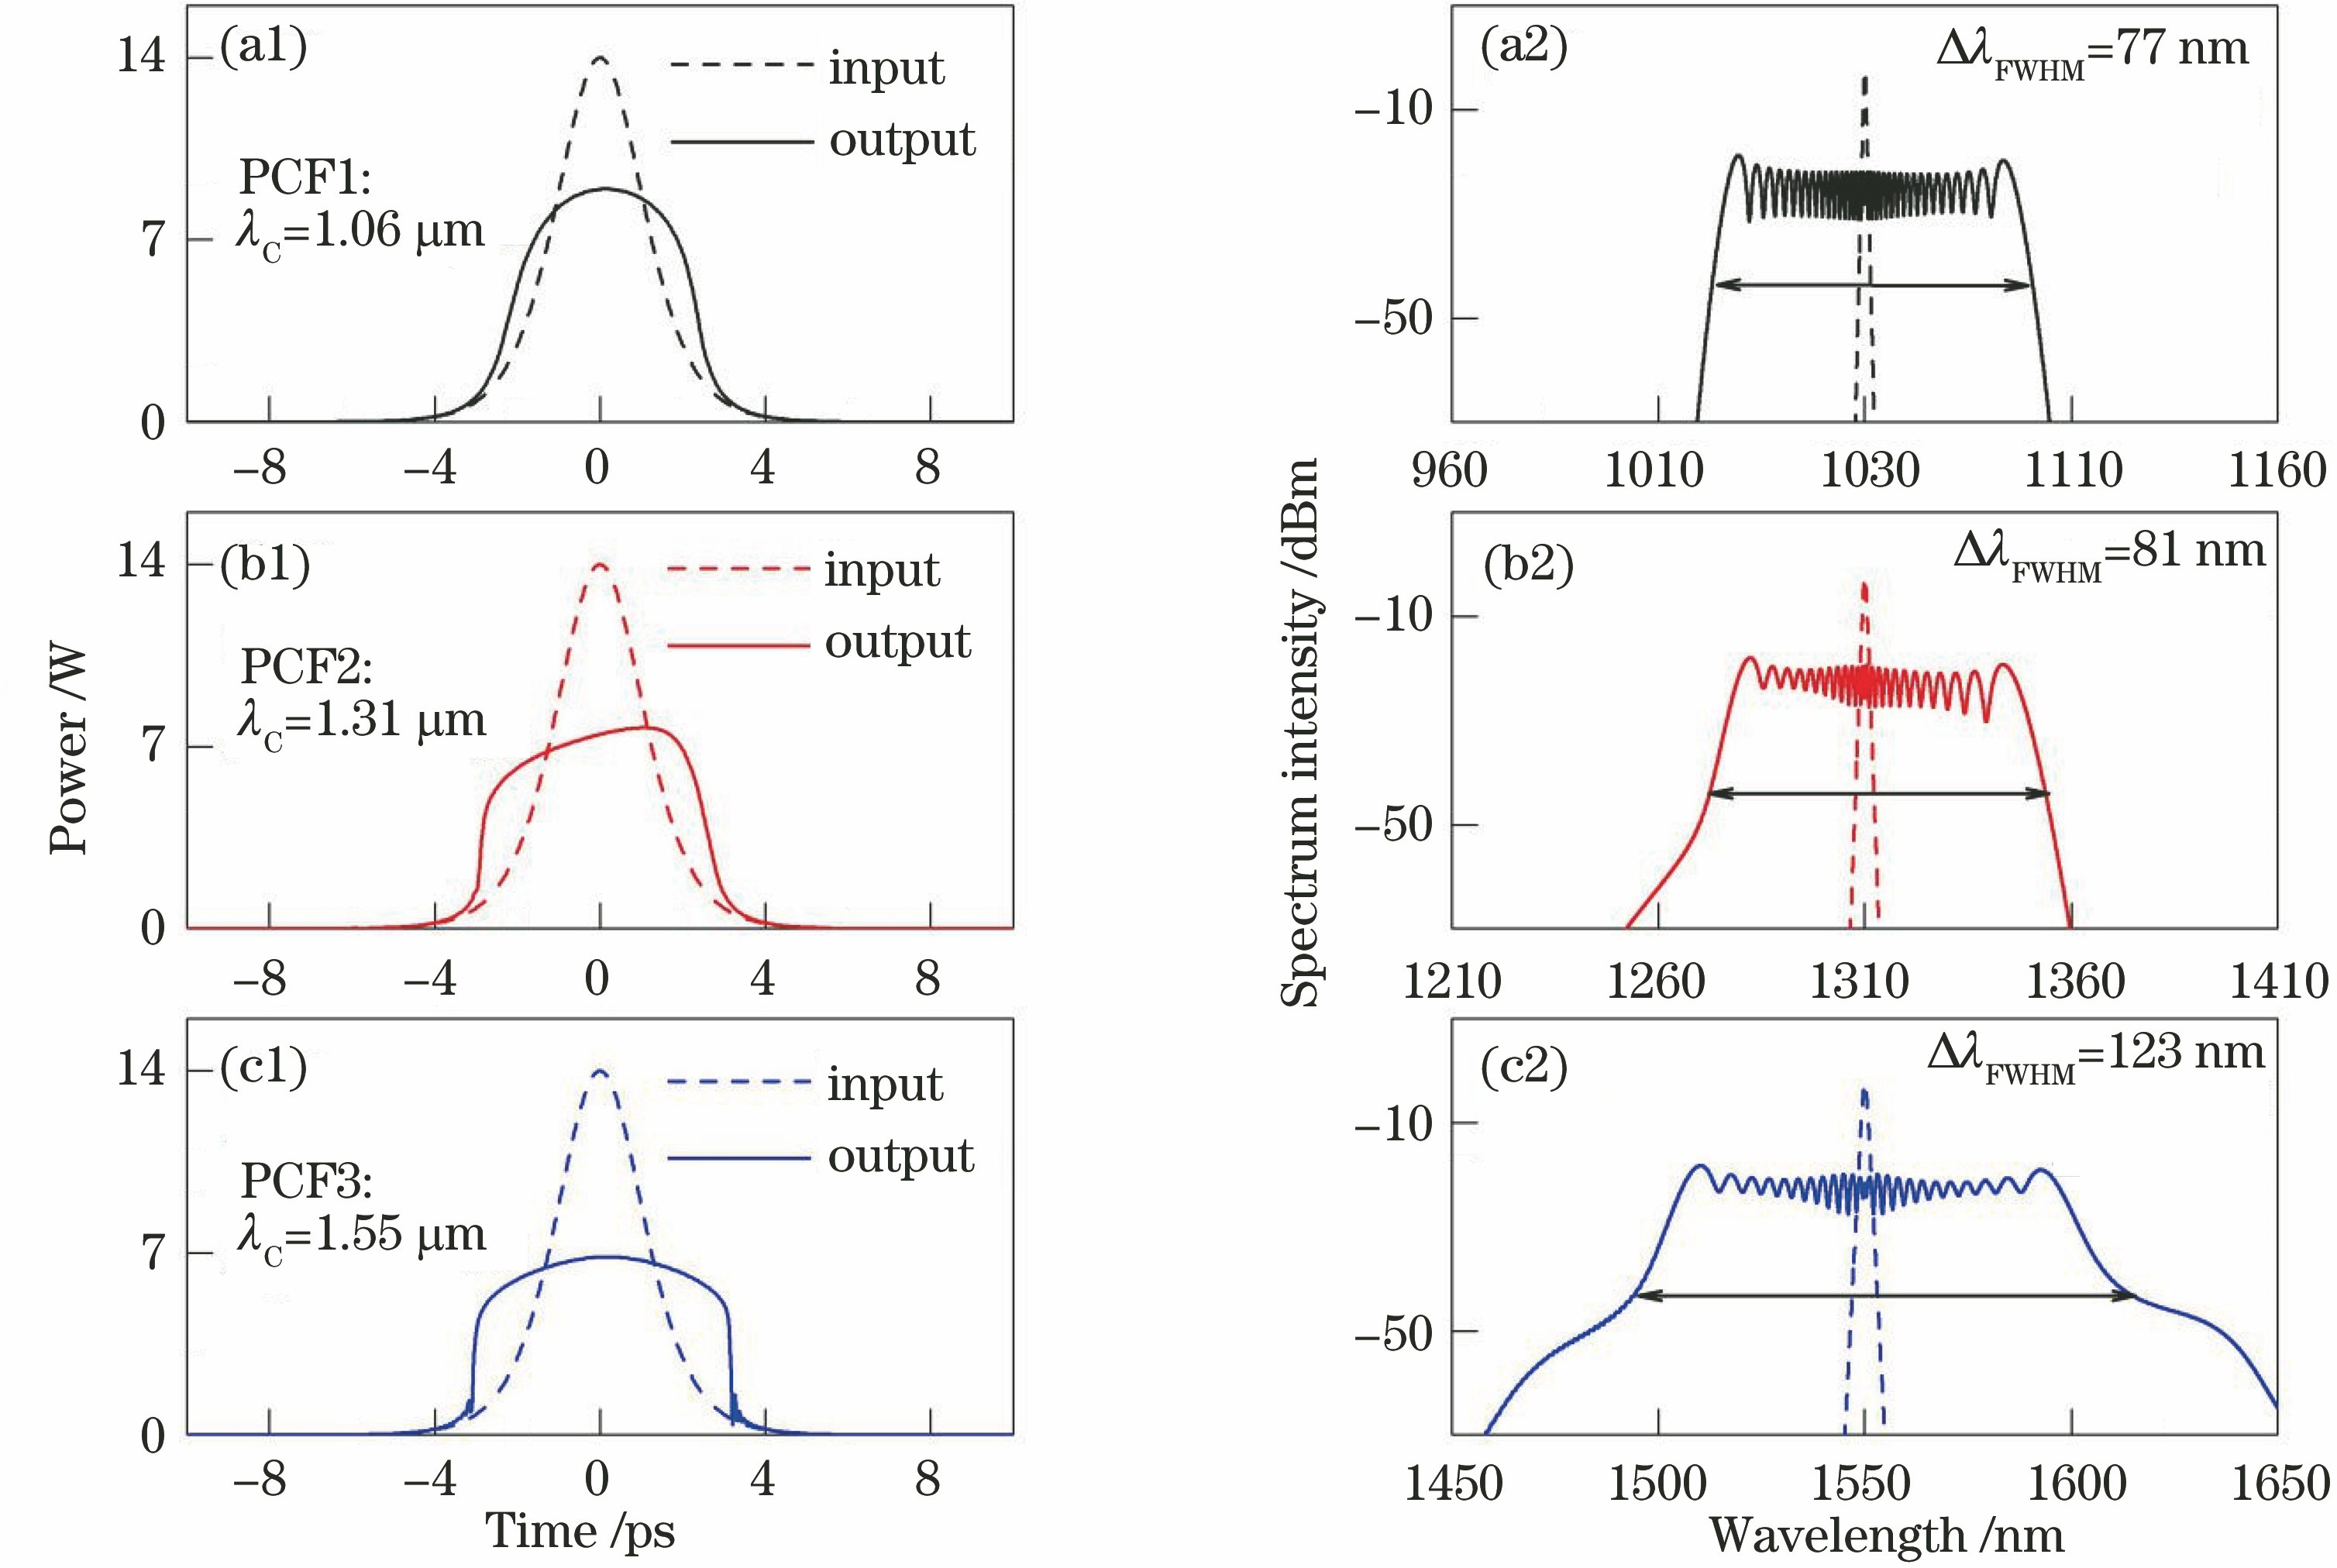
    Fig. 1. Temporal and spectral distributions of the input and output recorded after 120 m of propagation for pump pulses with different central wavelengths in different fibers: PCF1, PCF2, PCF3. (a) λC=1.06 μm; (b) λC=1.31 μm; (c) λC=1.55 μm
    Evolution of the output spectra FWHM ΔλFWHM and the corresponding axial resolution of OCT systems lr for pump pulses with different central wavelengths in corresponding different fibers after a distance of 120 m versus the soliton factor N in the range from 55 to 95. (a) Output spectra FWHM ΔλFWHM; (b) corresponding axial resolution of OCT systems lr
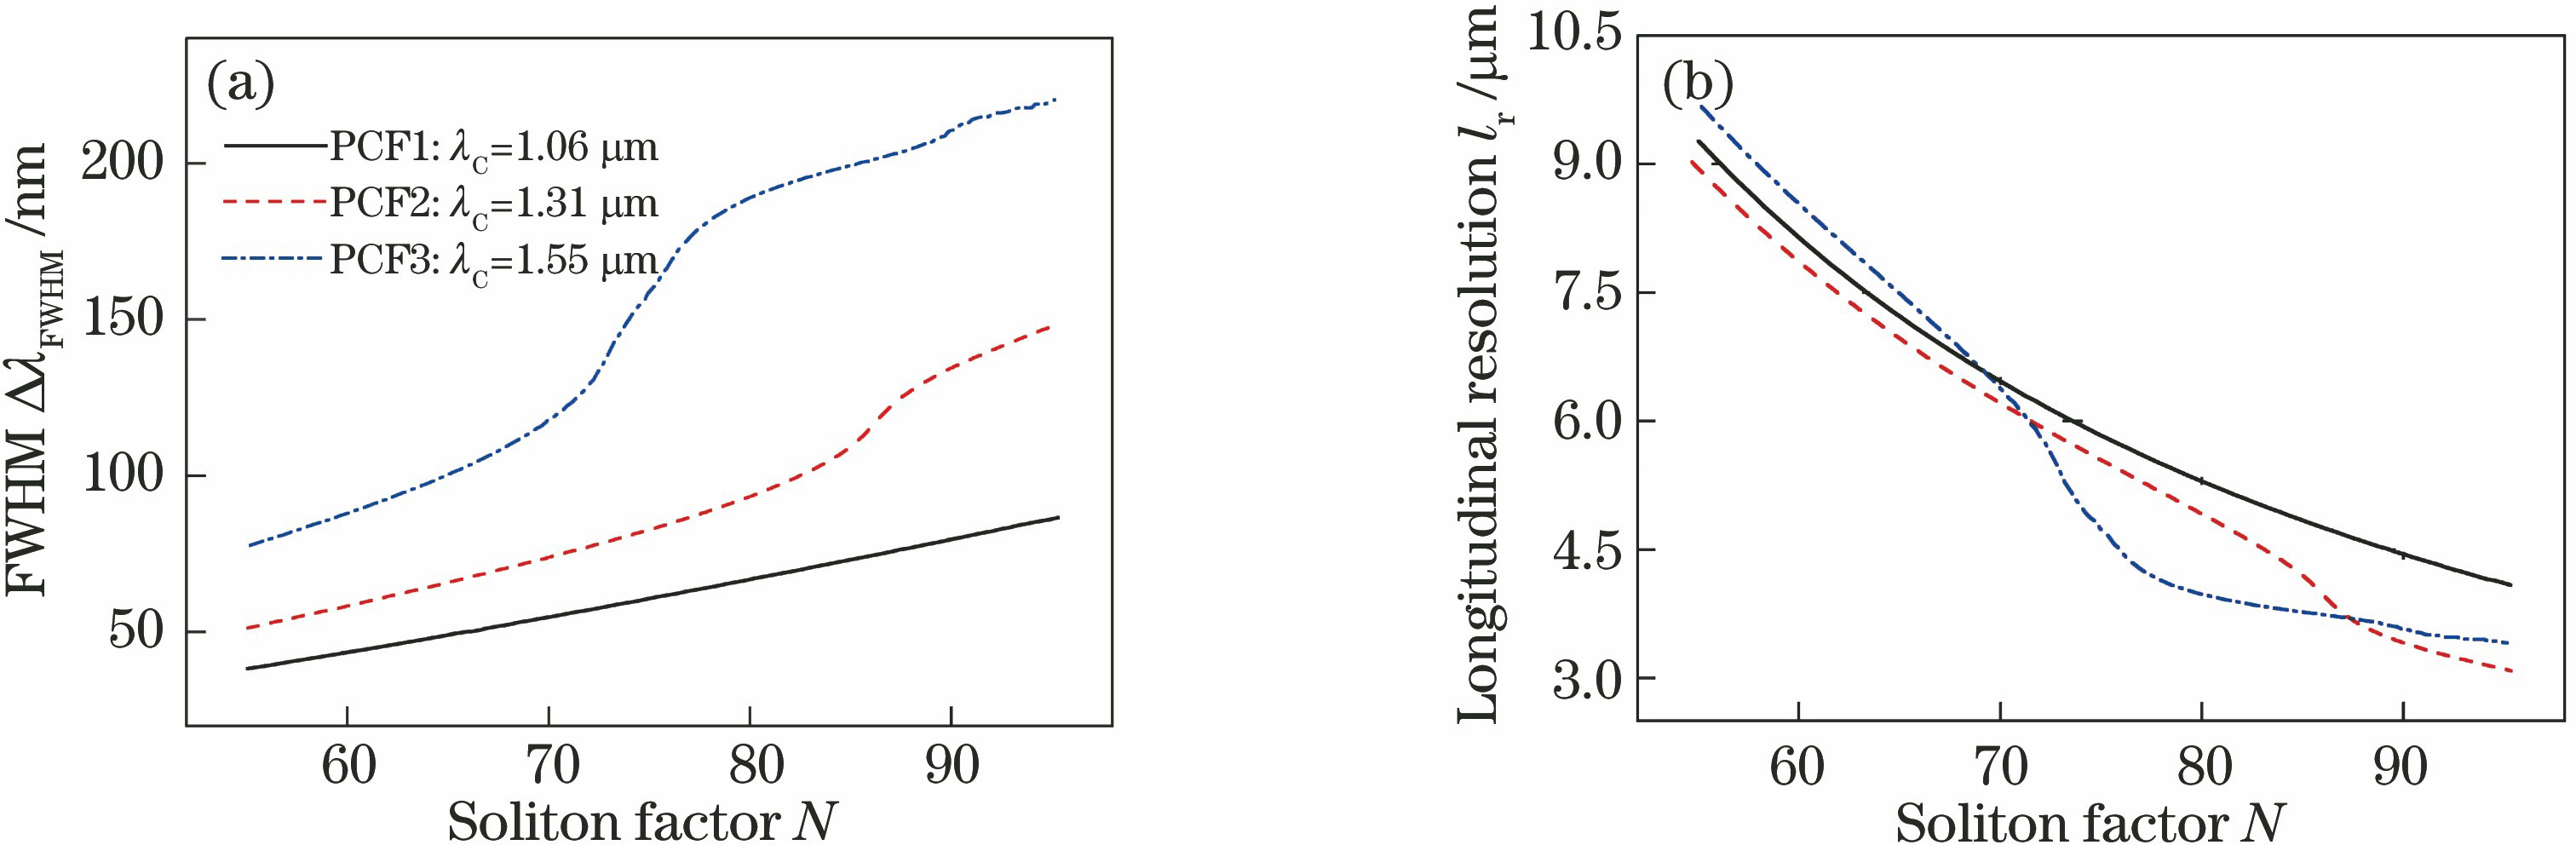
    Fig. 2. Evolution of the output spectra FWHM ΔλFWHM and the corresponding axial resolution of OCT systems lr for pump pulses with different central wavelengths in corresponding different fibers after a distance of 120 m versus the soliton factor N in the range from 55 to 95. (a) Output spectra FWHM ΔλFWHM; (b) corresponding axial resolution of OCT systems lr
    Temporal and spectral distributions of the output recorded after 180 m of propagation in PCF3 for different pump pulse peak powers. (a) P0=4 W; (b) P0=8 W; (c) P0=15 W; (d) P0=18 W; (e) P0=20 W
    Fig. 3. Temporal and spectral distributions of the output recorded after 180 m of propagation in PCF3 for different pump pulse peak powers. (a) P0=4 W; (b) P0=8 W; (c) P0=15 W; (d) P0=18 W; (e) P0=20 W
    Evolution of the output 10 dB bandwidth Δλ10 dB and flatness SFlat after a distance of 180 m in PCF3 versus pump pulse peak power P0 in the range from 2 to 22.5 W, in which the blue vertical dot-and-dash line represents the preferred results
    Fig. 4. Evolution of the output 10 dB bandwidth Δλ10 dB and flatness SFlat after a distance of 180 m in PCF3 versus pump pulse peak power P0 in the range from 2 to 22.5 W, in which the blue vertical dot-and-dash line represents the preferred results
    Temporal and spectral distributions of the output recorded after 180 m of propagation in PCF3 for different pump pulse widths. (a) TFWHM=0.6 ps; (b) TFWHM=1.0 ps; (c) TFWHM=1.4 ps; (d) TFWHM=1.8 ps; (e) TFWHM=2.2 ps
    Fig. 5. Temporal and spectral distributions of the output recorded after 180 m of propagation in PCF3 for different pump pulse widths. (a) TFWHM=0.6 ps; (b) TFWHM=1.0 ps; (c) TFWHM=1.4 ps; (d) TFWHM=1.8 ps; (e) TFWHM=2.2 ps
    Evolution of the output 10 dB bandwidth and flatness after a distance of 180 m PCF3 versus initial pulse width in the range from 0.5 to 2.4 ps, in which the blue vertical dot-and-dash line represents the preferred results
    Fig. 6. Evolution of the output 10 dB bandwidth and flatness after a distance of 180 m PCF3 versus initial pulse width in the range from 0.5 to 2.4 ps, in which the blue vertical dot-and-dash line represents the preferred results
    Distribution of the output spectra recorded after 120 m of propagation in PCF3 for four pump pulses with different initial parameters. (a) P0=14 W, TFWHM=2 ps; (b) P0=22 W, TFWHM=2 ps; (c) P0=14 W, TFWHM=1 ps
    Fig. 7. Distribution of the output spectra recorded after 120 m of propagation in PCF3 for four pump pulses with different initial parameters. (a) P0=14 W, TFWHM=2 ps; (b) P0=22 W, TFWHM=2 ps; (c) P0=14 W, TFWHM=1 ps
    Evolution of the output 10 dB bandwidth and the corresponding flatness in 80~180 m for pump pulses with different shapes in PCF3 versus fiber length in the range from 0 to 180 m. (a) Output 10 dB bandwidth; (b) corresponding flatness
    Fig. 8. Evolution of the output 10 dB bandwidth and the corresponding flatness in 80~180 m for pump pulses with different shapes in PCF3 versus fiber length in the range from 0 to 180 m. (a) Output 10 dB bandwidth; (b) corresponding flatness
    ParameterPCF1[10]PCF2[11]PCF3[12]
    λC /μm1.061.311.55
    β2 /(ps2·km-1)0.110.28770.3359
    β3 /(ps3·km-1)0.0-0.004544-0.00079
    β4 /(ps4·km-1)0.00.00.0003
    γ /(W-1·km-1)79.956.360.5
    Table 1. Characteristic parameters of the three PCFs for medical applications
    Jiyang Tian, Guangye Yang, Sandan Wang, Jinpeng Yuan. Optimization of Optical Coherence Tomography Light Source Based on Pump Pulse of Medical Photonic Crystal Fibers[J]. Acta Optica Sinica, 2021, 41(6): 0606001
    Download Citation