• Laser & Optoelectronics Progress
  • Vol. 59, Issue 1, 0114005 (2022)
Xin Li1、2, Tong Zhang1、2, Lingfei Ji1、2、*, and Litian Zhang1、2
Author Affiliations
  • 1Institute of Laser Engineering, Beijing University of Technology, Beijing 100124, China
  • 2Key Laboratory of Trans-Scale laser Manufacturing Technology, Ministry of Education, Beijing University of Technology, Beijing 100124, China
  • show less
    DOI: 10.3788/LOP202259.0114005 Cite this Article Set citation alerts
    Xin Li, Tong Zhang, Lingfei Ji, Litian Zhang. Study on Self-Forming Behavior and Mechanism of Silicon Microholes by Picosecond Laser Scanning[J]. Laser & Optoelectronics Progress, 2022, 59(1): 0114005 Copy Citation Text show less
    Laser scanning path diagram
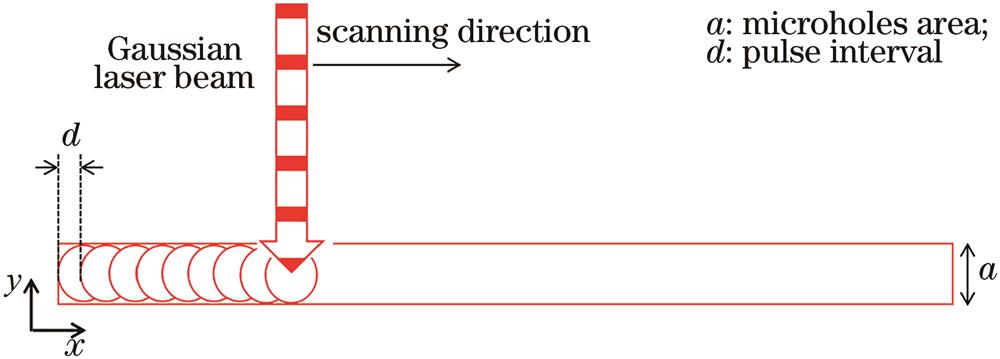
    Fig. 1. Laser scanning path diagram
    Microhole images of different pulse energy densities, ×50. (a) 0.28 J/cm2; (b) 0.52 J/cm2; (c) 0.68 J/cm2; (d) 0.79 J/cm2; (e) 1.59 J/cm2; (f) 2.39 J/cm2; (g) 3.18 J/cm2; (h) 4.77 J/cm2; (i) 6.37 J/cm2
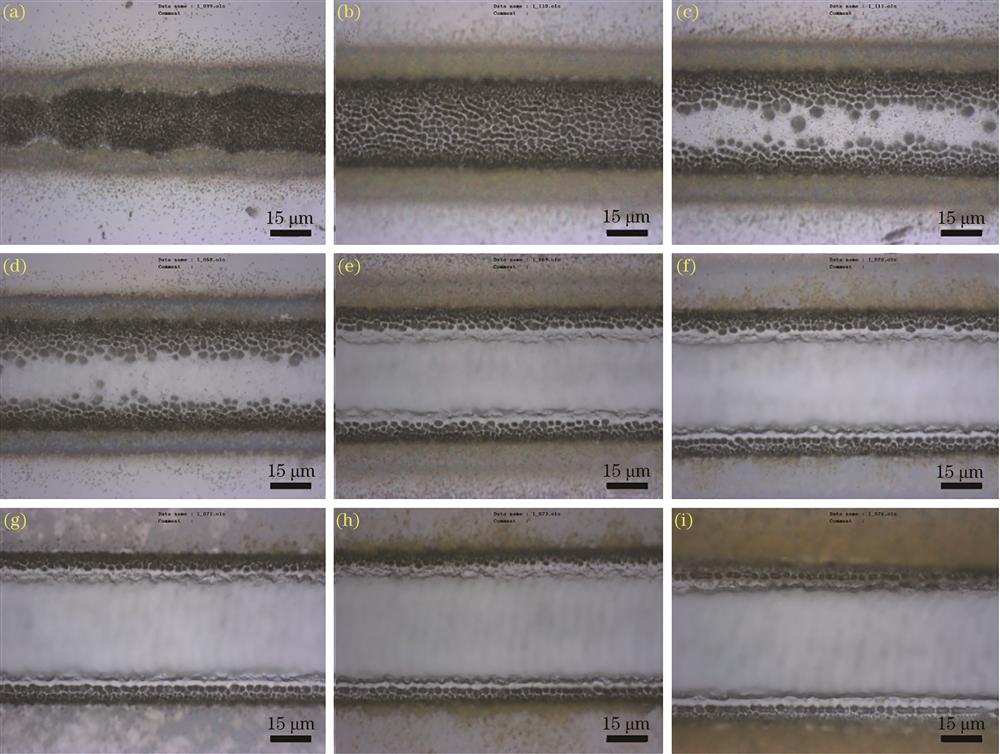
    Fig. 2. Microhole images of different pulse energy densities, ×50. (a) 0.28 J/cm2; (b) 0.52 J/cm2; (c) 0.68 J/cm2; (d) 0.79 J/cm2; (e) 1.59 J/cm2; (f) 2.39 J/cm2; (g) 3.18 J/cm2; (h) 4.77 J/cm2; (i) 6.37 J/cm2
    Experimental results. (a) SEM of grooves; (b) a partial enlargement of Fig. (a); (c) SEM of microholes; (d) a partial enlargement of Fig. (c)
    Fig. 3. Experimental results. (a) SEM of grooves; (b) a partial enlargement of Fig. (a); (c) SEM of microholes; (d) a partial enlargement of Fig. (c)
    Microhole images of different repeat scan times, ×50. (a) 1 time; (b) 5 times; (c) 10 times; (d) 15 times; (e) 20 times;
    Fig. 4. Microhole images of different repeat scan times, ×50. (a) 1 time; (b) 5 times; (c) 10 times; (d) 15 times; (e) 20 times;
    Unilateral microhole images at different scanning speeds, ×100. (a) 1400 mm/s; (b) 1200 mm/s; (c) 1000 mm/s; (d) 800 mm/s
    Fig. 5. Unilateral microhole images at different scanning speeds, ×100. (a) 1400 mm/s; (b) 1200 mm/s; (c) 1000 mm/s; (d) 800 mm/s
    Surface maximum temperature curves of different pulse energy densities
    Fig. 6. Surface maximum temperature curves of different pulse energy densities
    Simulation of temperature field in a pulse cycle. (a) 80 μs; (b) 81 μs; (c) 83 μs; (d) 84 μs
    Fig. 7. Simulation of temperature field in a pulse cycle. (a) 80 μs; (b) 81 μs; (c) 83 μs; (d) 84 μs
    Schematic of microhole evolution process
    Fig. 8. Schematic of microhole evolution process
    Relationship between maximum temperature at edge of groove and number of effective pulses per unit area
    Fig. 9. Relationship between maximum temperature at edge of groove and number of effective pulses per unit area
    Power P /W0.71.31.72.04.06.08.012.016.0
    Energy density J /(J·cm-20.280.520.680.791.592.393.184.776.37
    Table 1. Comparison table of laser power and energy density
    Xin Li, Tong Zhang, Lingfei Ji, Litian Zhang. Study on Self-Forming Behavior and Mechanism of Silicon Microholes by Picosecond Laser Scanning[J]. Laser & Optoelectronics Progress, 2022, 59(1): 0114005
    Download Citation