- Journal of Inorganic Materials
- Vol. 37, Issue 4, 413 (2022)
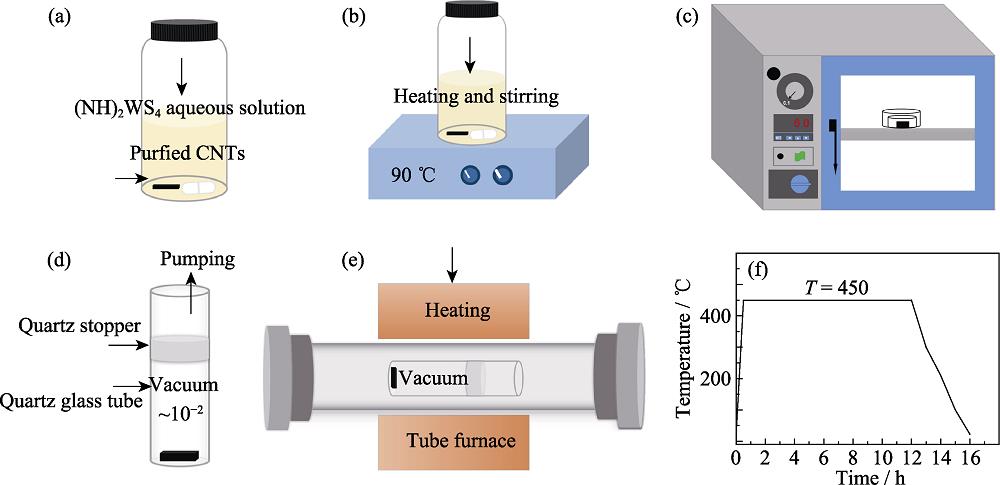
1. Schematic diagram of carbon nanotube filling
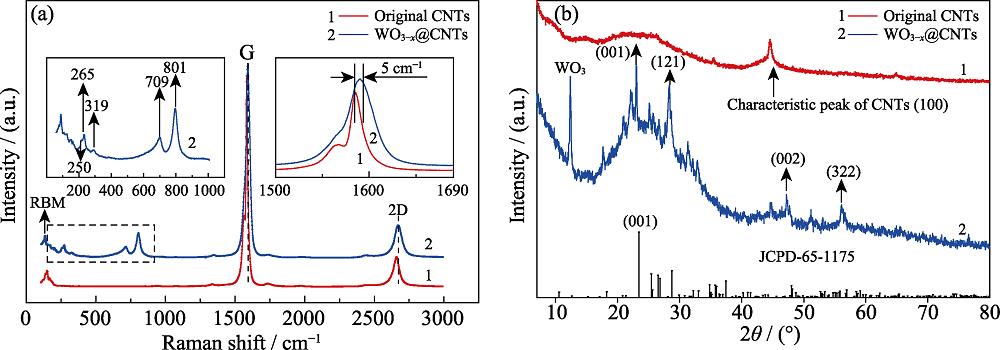
2. (a) Raman spectra and (b) XRD patterns of CNTs before (red) and after (blue) filling
3. (a, b, c) ADF-STEM images of three types of filled structures inside the CNTs. and (d, e) EELS spectra of oxygen and carbon elements
4. Atomic structure of an individual W3O8 nanowire filled inside CNT
5. ADF-STEM analyses of W3O8 nanowires with different diameters

Download Citation

Set citation alerts for the article
Please enter your email address
© Copyright 2018-2021 | Chinese Laser Press. All Rights Reserved 沪ICP备15018463号-20